• Home
  • Forums
  • Trades
  • News
  • Calendar
  • Market
  • Brokers
  • Login
  • Join
  • 11:37am
Menu
  • Forums
  • Trades
  • News
  • Calendar
  • Market
  • Brokers
  • Login
  • Join
  • 11:37am
Sister Sites
  • Metals Mine
  • Energy EXCH
  • Crypto Craft

Options

Bookmark Thread

First Page First Unread Last Page Last Post

Print Thread

Similar Threads

Trading Made Simple 143,042 replies

Trading Made Simple the right way, and other trading lessons 329 replies

Indicators for the 'Trading Made Simple' system 343 replies

MTF Indicators for the 'Trading Made Simple' system 241 replies

Trading Made Simple system follower - Thanks to eelfranz 9 replies

  • Trading Systems
  • /
  • Reply to Thread
  • Subscribe
  • 3,993
Attachments: Trading Made Simple(r)
Exit Attachments
Tags: Trading Made Simple(r)
Cancel

Trading Made Simple(r)

  • Last Post
  •  
  • 1 427428Page 429430431 433
  • 1 Page 429 433
  •  
  • Post #8,561
  • Quote
  • May 10, 2023 8:29am May 10, 2023 8:29am
  •  Walddo
  • | Joined Apr 2023 | Status: Member | 25 Posts
Quoting 4rx
Disliked
{quote} Hi Waldo..... any update on this? Cant find it ...hidden by TV ?
Ignored
Hey there...I didn't realize Tradingview has very stringent indicator publishing policies and my RHO publication didn't meet those guidelines.

I am not sure if it was because I put a link to this thread in the description or the mod just truly found it "not useful".

You should be able to just paste this into a pinescript editor and add it to your chart:

//@version=5
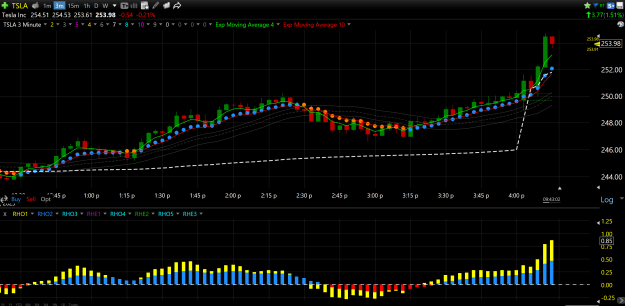
indicator("Robinhood Oscillator", shorttitle="RHO")

// First MACD Calculations
fast_ma1 = ta.ema(close, 6)
slow_ma1 = ta.ema(close, 10)
macd1 = fast_ma1 - slow_ma1
signal1 = ta.ema(macd1, 9)

// Second MACD Calculations
fast_ma2 = ta.ema(close, 11)
slow_ma2 = ta.ema(close, 13)
macd2 = fast_ma2 - slow_ma2
signal2 = ta.ema(macd2, 9)

// Plotting
plot(macd1, title="MACD 1", color=color.rgb(255, 0, 255))
//plot(signal1, title="Signal 1", color=color.yellow)
plot(macd2, title="MACD 2", color=color.rgb(0,255,0))
//plot(signal2, title="Signal 2", color=color.orange)
hline(0, title="Zero Line", color=color.silver)
 
1
  • Post #8,562
  • Quote
  • May 21, 2023 4:45am May 21, 2023 4:45am
  •  csethna
  • | Joined Dec 2013 | Status: Member | 100 Posts
@Robinhood
Hello there,
I am using the original template to trade the daily and H4 timeframes. the only change is using 45 and 55 levels for Rsi, instead of 50.
Works well for me. My only hurdle is doing multiple timeframe analysis to determine trend. A long time back you had given me a brief answer, but I have not been able to apply it successfully.
Would you please explain it again with examples on how to do it correctly. Your help would be much appreciated. Thanks.
 
 
  • Post #8,563
  • Quote
  • Edited 6:10pm May 21, 2023 5:19pm | Edited 6:10pm
  •  RobinHood
  • Joined Jul 2009 | Status: Trade What U See Not What You Think | 1,391 Posts
Quoting csethna
Disliked
@Robinhood Hello there, I am using the original template to trade the daily and H4 timeframes. the only change is using 45 and 55 levels for Rsi, instead of 50. Works well for me. My only hurdle is doing multiple timeframe analysis to determine trend. A long time back you had given me a brief answer, but I have not been able to apply it successfully. Would you please explain it again with examples on how to do it correctly. Your help would be much appreciated. Thanks.
Ignored
1. Regarding the RSI, more than 25 years ago I did the same thing by using the 45 & 55. Then when I became proficient at writing trading code via EasyLanguage (TradeStation) I was able to have the computer optimize various parameters such as the RSI via back-testing over a given period of time.

The problem I found out was that on one Forex pair, or one stock, or one specific Futures contract the optimal RSI numbers on each side of the 50 would be different, like 42 & 53, or 44 & 58, or 41 & 56, etc. Then when you changed the length of the back-testing periods all of the optimal RSI numbers would change again. So that's why I now only use the 50. But as you probably know, I always have at least one or more indicator(s) along with the RSI to confirm entries and exits.

2. Regarding multiple timeframe analysis, I don't think that I am the best person to ask about how to do it to determine the trend but I can tell you how I do it. I look at one time frame higher than the time frame that I am trading. And under normal circumstances I don't trade against the trend of the higher time frame.

Now one can argue that the time frame that you are trading must turn before the next higher time frame does, thereby causing you to miss some trades and that would be true, but personally I would rather miss some trades than to knowingly and intentionally trade against the trend of the higher time frame.

If anyone else that views this thread wants to share how they do it then I would welcome them to do so.
Always a Student, Never a Master - Emulate What Works
 
2
  • Post #8,564
  • Quote
  • May 22, 2023 10:28pm May 22, 2023 10:28pm
  •  csethna
  • | Joined Dec 2013 | Status: Member | 100 Posts
Quoting RobinHood
Disliked
{quote} 1. Regarding the RSI, more than 25 years ago I did the same thing by using the 45 & 55. Then when I became proficient at writing trading code via EasyLanguage (TradeStation) I was able to have the computer optimize various parameters such as the RSI via back-testing over a given period of time. The problem I found out was that on one Forex pair, or one stock, or one specific Futures contract the optimal RSI numbers on each side of the 50 would be different, like 42 & 53, or 44 & 58, or 41 & 56, etc. Then when you changed the length of the...
Ignored
Thank you for your answer. on the tms thread, emmanuel had explained it but the method was different. my IQ doesn't help in understanding it optimally. I hope someone on this thread can explain using this method with a couple of examples.
 
1
  • Post #8,565
  • Quote
  • May 22, 2023 11:50pm May 22, 2023 11:50pm
  •  nanacarter
  • | Joined Aug 2016 | Status: Member | 116 Posts
Quoting RobinHood
Disliked
{quote} 1. Regarding the RSI, more than 25 years ago I did the same thing by using the 45 & 55. Then when I became proficient at writing trading code via EasyLanguage (TradeStation) I was able to have the computer optimize various parameters such as the RSI via back-testing over a given period of time. The problem I found out was that on one Forex pair, or one stock, or one specific Futures contract the optimal RSI numbers on each side of the 50 would be different, like 42 & 53, or 44 & 58, or 41 & 56, etc. Then when you changed the length of the...
Ignored
Which timeframe do you trade the most?
 
 
  • Post #8,566
  • Quote
  • May 24, 2023 1:40pm May 24, 2023 1:40pm
  •  RobinHood
  • Joined Jul 2009 | Status: Trade What U See Not What You Think | 1,391 Posts
Quoting nanacarter
Disliked
{quote} Which timeframe do you trade the most?
Ignored
Daily
Always a Student, Never a Master - Emulate What Works
 
 
  • Post #8,567
  • Quote
  • Jun 1, 2023 6:06am Jun 1, 2023 6:06am
  •  rhzishan
  • | Joined Jul 2019 | Status: Money comes and goes... | 20 Posts
Hello there! I couldn't help but notice that this thread seems to be quite inactive. I'm curious to know if this indicates that the method we've been discussing, RH's TMSr, is no longer considered profitable. If it is indeed the case, I'm interested in hearing from those who are still actively trading using RH's TMSr method. If you're one of them, I would love to connect and learn more about your experiences. Let's revive this discussion and continue our exploration together!
 
 
  • Post #8,568
  • Quote
  • Jun 5, 2023 11:20pm Jun 5, 2023 11:20pm
  •  29071989
  • | Joined May 2023 | Status: Junior Member | 6 Posts
Quoting ajjuve
Disliked
If RHO indicators MTF, It would be awesome.
Ignored
mr robinhood! hello sir how you doing? are this teemplates avaliable for mt5?

thanks a lot
regards!
 
 
  • Post #8,569
  • Quote
  • Jun 6, 2023 4:04am Jun 6, 2023 4:04am
  •  Iakov
  • | Joined Nov 2019 | Status: Member | 5 Posts
Quoting 29071989
Disliked
{quote} mr robinhood! hello sir how you doing? are this teemplates avaliable for mt5? thanks a lot regards!
Ignored
Hello, try this
Attached Image (click to enlarge)
Click to Enlarge

Name: screenshot.png
Size: 28 KB
Attached File(s)
File Type: zip TMSR mt5.zip   46 KB | 99 downloads
 
 
  • Post #8,570
  • Quote
  • Jun 13, 2023 8:56pm Jun 13, 2023 8:56pm
  •  SF422
  • | Joined Mar 2023 | Status: Member | 12 Posts
When taking a Daily position and you are considering the RSI from the Weekly, do you take the reading from the end of the previous week and do you take the reading during the course of the current week prior to placing your trade?
As an example you are doing your end of week top down analysis on Saturday where the markets are closed and the weekly RSI is 45. Today is Wednesday and the weekly RSI is now reading 51

Feel free to reply with your experiences
 
 
  • Post #8,571
  • Quote
  • Jun 23, 2023 5:50am Jun 23, 2023 5:50am
  •  SF422
  • | Joined Mar 2023 | Status: Member | 12 Posts
Attached Image (click to enlarge)
Click to Enlarge

Name: screenshot.png
Size: 63 KB
 
1
  • Post #8,572
  • Quote
  • Jun 23, 2023 12:08pm Jun 23, 2023 12:08pm
  •  nanacarter
  • | Joined Aug 2016 | Status: Member | 116 Posts
Quoting Iakov
Disliked
{quote} Hello, try this {file} {image}
Ignored
kindly share the currency changer indicator
 
 
  • Post #8,573
  • Quote
  • Jun 24, 2023 1:44pm Jun 24, 2023 1:44pm
  •  Iakov
  • | Joined Nov 2019 | Status: Member | 5 Posts
Quoting nanacarter
Disliked
{quote} kindly share the currency changer indicator
Ignored
Here it is
Attached File(s)
File Type: mq5 Symbol Changer.mq5   7 KB | 30 downloads
 
 
  • Post #8,574
  • Quote
  • Jun 25, 2023 7:38am Jun 25, 2023 7:38am
  •  nanacarter
  • | Joined Aug 2016 | Status: Member | 116 Posts
Quoting Iakov
Disliked
{quote} Here it is {file}
Ignored
Thanks
 
 
  • Post #8,575
  • Quote
  • Edited 1:41pm Jun 25, 2023 8:54am | Edited 1:41pm
  •  sunnym
  • Joined May 2012 | Status: Member | 397 Posts
Quoting SF422
Disliked
{image}
Ignored
thats best method in this case
{ virus risk deleted by staff }
Youtube:sunnymdlalose
 
2
  • Post #8,576
  • Quote
  • Jun 25, 2023 11:20am Jun 25, 2023 11:20am
  •  CupofTea
  • Joined Jun 2023 | Status: Member | 106 Posts
Quoting teatime
Disliked
{quote} Thank you very much
Ignored
that is not my post !!!!
dont klick the files from Roberk !!!!
 
 
  • Post #8,577
  • Quote
  • Jun 28, 2023 2:11am Jun 28, 2023 2:11am
  •  Celal
  • | Joined Sep 2017 | Status: Member | 261 Posts
Quoting RobinHood
Disliked
Currently, the only stock that I am day trading is Tesla...due to the volume and the volatility. Here is what my chart looks like, it's a 3 min. chart. {image} Here is what my Daily Tesla chart looks like. I use this exact setup to position trade and day trade stocks. I like it because it NEVER misses a good trade. {image} * This template is not something that I want share because it has taken me about 3 years to perfect it. Hundreds and hundreds of hours.
Ignored
Hi RobinHood,
I hope you are fine. I want to learn the indicator on 3 minute chart which is red blue dotted and plotted on price. Iwant to apply it on trading view.Thanks for all.
 
 
  • Post #8,578
  • Quote
  • Edited 10:12am Jun 28, 2023 9:55am | Edited 10:12am
  •  RobinHood
  • Joined Jul 2009 | Status: Trade What U See Not What You Think | 1,391 Posts
Quoting Celal
Disliked
{quote} Hi RobinHood, I hope you are fine. I want to learn the indicator on 3 minute chart which is red blue dotted and plotted on price. Iwant to apply it on trading view.Thanks for all.
Ignored
As I said in my post..."This template is not something that I want share because it has taken me about 3 years to perfect it. Hundreds and hundreds of hours".

I'll tell you why I don't want to share it. It's because someone will come along and start selling it to other traders (as if it's their own). I know because I have seen it happen with the Robinhood Oscillator and other things I have created.

But I will share something that mimics the dots quite well. It's the 4 ema and the 10 ema. I have plotted the 2 emas on the chart below as green and red lines. BTW, I just recently figured this out totally by accident.
Attached Image (click to enlarge)
Click to Enlarge

Name: TSLA 3 Min.PNG
Size: 169 KB
Always a Student, Never a Master - Emulate What Works
 
2
  • Post #8,579
  • Quote
  • Jun 29, 2023 2:17am Jun 29, 2023 2:17am
  •  SF422
  • | Joined Mar 2023 | Status: Member | 12 Posts
Hi Robinhood

Is there any significance of the 14 Period stochastics turning red above the 50%?
Attached Image (click to enlarge)
Click to Enlarge

Name: NZDJPYH4.png
Size: 26 KB
 
 
  • Post #8,580
  • Quote
  • Jun 29, 2023 9:31am Jun 29, 2023 9:31am
  •  RobinHood
  • Joined Jul 2009 | Status: Trade What U See Not What You Think | 1,391 Posts
Quoting SF422
Disliked
Hi Robinhood Is there any significance of the 14 Period stochastics turning red above the 50%? {image}
Ignored
No
Always a Student, Never a Master - Emulate What Works
 
 
  • Trading Systems
  • /
  • Trading Made Simple(r)
  • Reply to Thread
    • 1 427428Page 429430431 433
    • 1 Page 429 433
2 traders viewing now
  • More
Top of Page
  • Facebook
  • Twitter
About FF
  • Mission
  • Products
  • User Guide
  • Media Kit
  • Blog
  • Contact
FF Products
  • Forums
  • Trades
  • Calendar
  • News
  • Market
  • Brokers
  • Trade Explorer
FF Website
  • Homepage
  • Search
  • Members
  • Report a Bug
Follow FF
  • Facebook
  • Twitter

FF Sister Sites:

  • Metals Mine
  • Energy EXCH
  • Crypto Craft

Forex Factory® is a brand of Fair Economy, Inc.

Terms of Service / ©2023