Hi All.
This is my very first post but i want to thank RH for opening up and sharing these strategies and for everyone else that has contributed. I am at page 70 but keep on re-reading from page 1 to cement the concepts in my head.
Could i get some feedback on my trades I opened this morning on a DEMO account.
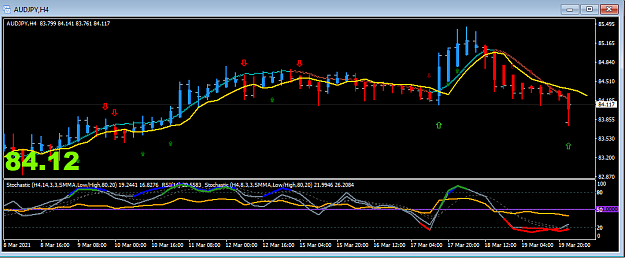
AUD-JPY: Went short on the last bar (just after 10am Brisbane time)
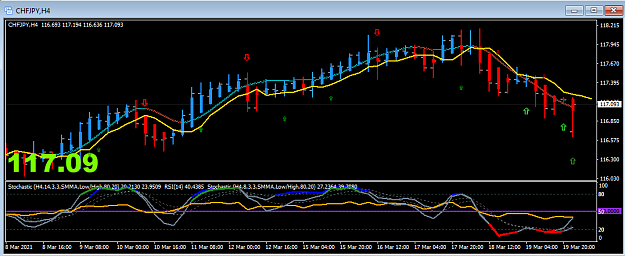
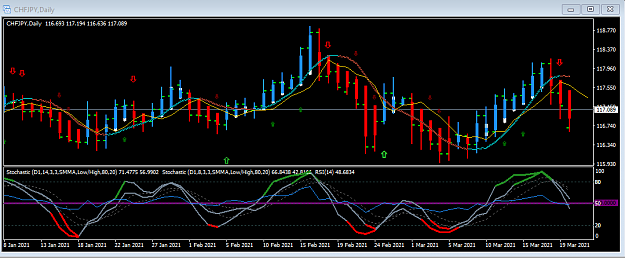
CHF-JPY: Went short on last bar (as a continuation trade)
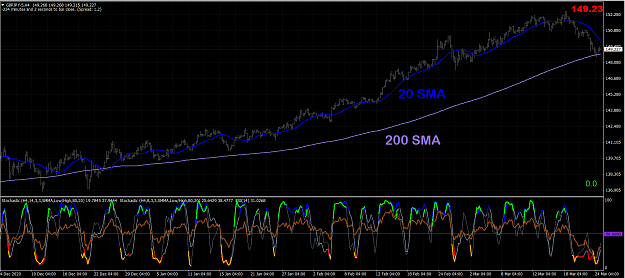
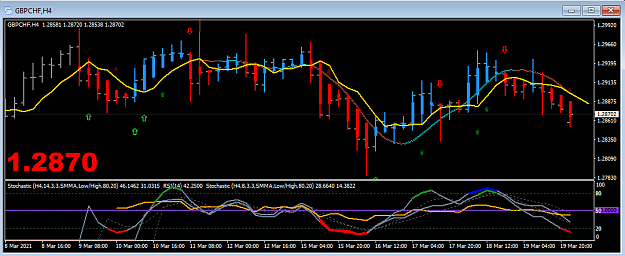
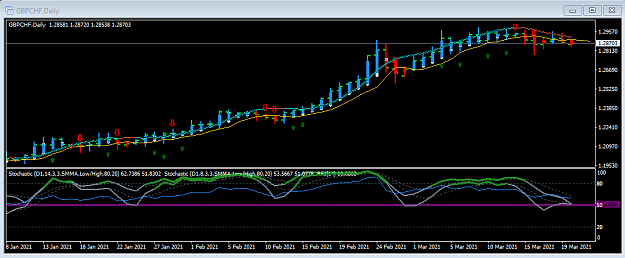
GBPCHF: Went short on crossover (wondering if i went 1 bar too early)
Thanks and appreciate any feedback.
This is my very first post but i want to thank RH for opening up and sharing these strategies and for everyone else that has contributed. I am at page 70 but keep on re-reading from page 1 to cement the concepts in my head.
Could i get some feedback on my trades I opened this morning on a DEMO account.
AUD-JPY: Went short on the last bar (just after 10am Brisbane time)
Attached Image (click to enlarge)
Attached Image (click to enlarge)
CHF-JPY: Went short on last bar (as a continuation trade)
Attached Image (click to enlarge)
Attached Image (click to enlarge)
GBPCHF: Went short on crossover (wondering if i went 1 bar too early)
Attached Image (click to enlarge)
Attached Image (click to enlarge)
Thanks and appreciate any feedback.