Our only job as traders is to make money consistently. To create an equity graph that slopes from the bottom left of our screen to the top right.
So how do we do that?
Find a market truth you can believe in. Stick with it. If your P&L for 2018 does not slope upwards my personal advice would be to change something. Maybe everything.
Define what type of a trader you are. For example I am a stats based reversion to mean trader. I am not a trend trader. I am not a jack of all trades.
Here's a potential process:
1) Find a market truth that is unshakeable (For example mine is "Price always returns to its average")
2) Build a trading system around this truth
3) If you need data that is not freely available build software to calculate it for you. There are loads of programmers out there - tell them what you want. Build it. Test it.
4) After enough trial and error validate your market truth and build a trading system that works
5) As you are using a unique approach with custom made indicators very few will be trading this approach with you
6) Suddenly you are no longer in the large swimming pool of drowning traders desperately trying to keep your ahead above water.
Rather you are in your own pool, designed by you and should anyone wish to join you in the pool, well they need your permission. Its peaceful, quiet and guess what - its where your equity curve will slope upwards from bottom left to top right
Wishing you all a successful 2019.
www.chartsmart.co.za
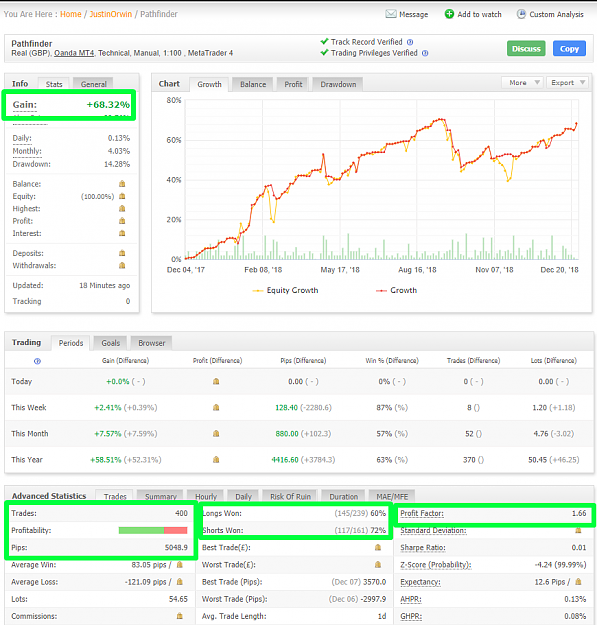
Attached Image (click to enlarge)