The market needs to behave in a specific way in order to keep it's "Randomness". Thus the market has structure that it needs to maintain. Points 1 en 2 are examples of this, but there are many more
Ignored
Wanderer, could you please pleasure us with your wisdom on the ways of randomness builds structure. How many structure builds might it contain, I opt for a 100 at least since the market is traded by many visible controllers.
{quote} I agree, point 3 is very interesting. {quote} Wanderer, could you please pleasure us with your wisdom on the ways of randomness builds structure. How many structure builds might it contain, I opt for a 100 at least since the market is traded by many visible controllers.
Ignored
Hi,
Apologies for not responding, I was otherwise occupied. There are more than one way to view market structure. I will post some thoughts on it next week.
{quote} Hi, Apologies for not responding, I was otherwise occupied. There are more than one way to view market structure. I will post some thoughts on it next week.
Ignored
Thank you. I'll patiently await your reply.
For now, let's feast our eyes on these white papers, research papers and structure analyses.
"“Existing theory indicates that information is brought to the market by liquidity takers rather than market makers. Among liquidity takers in FX, the evidence indicates that information comes from financial customers, especially leveraged investors. Information does not come from firms involved in international trade, small individual traders, or governments/central banks." - page 11, FX market dynamics (read: https://www.investopedia.com/article...s-leverage.asp)
"Leveraged Institutional Investors
Hedge Funds, CTA’s and other Asset Managers
High motivation to be informed, and evidence suggests they are the most
Make or lose money in accordance with the currency’s fluctuation in value
Standard practice of charging 20% incentive fee, 2% management
Strategies include: fundamentals, interest rate differentials, momentum and volatility" - page 12, idem
Read page 13 and onwards - Forex Market Structure.
"Among the experimental results is a single factor that can be held
responsible for most of the statistically significant impacts: the sequence
of transactions, set in motion by an inventory disruption, as the undesired
position is passed along from one market—maker to another, producing temporary
misallocations of currency inventories. This “hot—potato” trading has
implications for price efficiency as well. First, there is inventory bounce
in quoted prices that accompanies the passing along of an undesired inventory
position. Second, there is a disinformation effect on prices, as individual
market—makers may mistake a “hot potato” for a general shift in supply or
demand. In both cases, the resulting price adjustments can yield arbitrage
23
opportunities, price dispersion and serial correlation in price changes.
Given this, the theoretical implications are fairly clear. From this
perspective, the traditional view of market centralization as the key to
operational efficiency is correct. One important advantage of centralization
should be the ability to route orders directly to those who want them. If,
for example, two customers call the market simultaneously, one wanting to buy
yen for dollars, the other wanting dollars for yen, and both willing to
transact at a common price, an operationally efficient market should pair
these two off immediately, rather than letting two inventory positions meander
aimlessly through a forest of market—makers until they happen to coincide. At
the very least, such circuitous routing of currency positions produces an
unnecessary multiplication of trading volume. Bilateral netting agreements
and proposed multilateral payment netting schemes indicate that the implicit
inefficiency is economically significant.28
Existing microstructures in other markets suggest institutional
possibilities for centralization in this context. A radical possibility would
be centralization of the market—making function in a monopolistic dealer, in
the spirit of the stock exchange specialist. An idealized speci,alist system,
in which the dealer participates in every transaction either through the book
or for her own account, would clearly eliminate arbitrage opportunities and
price dispersion. Moreover, it would collapse a “hot—potato” sequence of
trades into a single transaction, in effect netting countermanding inventory
imbalances across market—makers. Indeed, considering only back—office costs
and the costs of financing inventory positions, economies of scale imply that
market—making should be a natural monopoly in the current microstructure. On
the other hand, previous theoretical work concludes that competition among
market—makers is desireable —— Stoll (1978), for example, demonstrates that
equilibrium market structure in a dealer market is generally not a monopoly ——
while the empirical observation of consistent growth in the number of marketmakers
argues strongly against a natural monopoly for dealer services.
Moreover, the capitalization required for a monopolistic foreign exchange
market—maker to establish creditworthiness would likely be prohibitive.
A more realistic possibility is a centralization of price information
24
only. This could be achieved by collecting live direct and brokered quotes on
an electronic network (similar to the NASDAQ system on the OTC stock market).
Such a system would eliminate any arbitrage opportunities and price dispersion
as defined here. Indeed, such systems have already begun to appear.29
Centralization of quotes would obviate price dispersion, arbitrage
opportunities and the adjustment interval, as measured here. Moreover, by
encouraging price priority of order execution, such a system would facilitate
the routing of currency positions to market—makers who want them, thus
reducing the number of “hot—potato” trades. The results here indicate that a
full centralization of price quotes should enhance the operational efficiency
of the market and lead to a significant ceteris paribus reduction in trading
volume. Adoption of such a fundamental microstructural change would
necessarily entail considerable coordination between market—makers, brokers
and regulators, however.
25
Notes
1. At the extreme, microstructural problems have been held to destroy
markets. Miller (1986), pp. 169—70, for example, holds microstructure
responsible for the failure of the inflation (CPI) futures contract at the
Coffee, Sugar and Cocoa Exchange.
2. Foreign exchange trading volume is taken from FRB-NY (1989); the annual
figure is based on 251 trading days per year. The corresponding figure for
global foreign exchange volume is $160.64 trillion (BIS 1990b). World GDP =
$16 trillion is a rough approximation; this represents an extrapolation from
UN (1989) estimates for 1986, using the 1986 growth rates in GDP since 1986,
and assuming that per capita GDP for Hungary and Poland was representative of
Eastern Europe.
3. See Flood (1991), p. 54.
4. More specifically, they state (p. 182) that, “The tremendous’ volume of
foreign exchange trading is another piece of evidence that reinforces the idea
of heterogeneous expectations, since it takes differences among market
participants to explain why they trade.”
5. While they do not rule out such an argument, the results in the present
paper do offer an alternative explanation. In particular, the heavy trading
volume and the relatively large price volatility that follow the morning
opening of trading may both be symptoms of an underlying common cause, namely
a wave of customer orders that disrupt the market as local customers begin
their day.
6. This result may be related to the fact that their screen—based prices are
not live quotes, but rather for “information purposes” only. Electronic
trading screens (e. g., Reuters and Telerate) are not considered in the
simulation model here. While such quotes doubtless contain some information
26
—— carefully constructed time—series statistics may be unbiased, for example
-- their usefulness for trading decisions is limited. Reuters displays only
one quote at a time, while Telerate has only five. More importantly, these
posted quotes are not treated as binding offers to transact by market
participants, but rather as “for information purposes”. Posted quotes must be
confirmed and can be repudiated at the whim of the posting bank, at little
cost to their ability to deal in the future (compare this to the reputational
cost to a bank that refuses to deal when called on the phone). As a result,
posted quotes can lag the market significantly. For example, it is not
uncommon to find quotes on Telerate as much as thirty minutes old, when in
fact the lifetime of quotes (i. e., the length of time that a telephone—based
bid or ask price would be considered a binding offer) should be measured in
seconds [see, e. g., Burnham (1990), p. 12].
7. Because of its detail, only an outline of the simulation model is provided
here. Details of the Bayesian learning model for market—makers are provided
in appendix A. A full specification of the model, including flowcharts and
copies of the Fortran simulation routines, are available upon request.
8. James Horhorst, as quoted by Mossberg (1988), p. 29R. Mr. Hohorst
directed foreign exchange trading in North America for Manufacturers Hanover.
9. A total of twelve different behavioral specifications were tried. Because
the conclusions were robust to all these variations, we report only two
representative specifications here. In addition, an adaptive expectations
model was tried; it exhibited extreme cobweb-type instability, and thus was
considered an unsatisfactory approximation to the real market.
10. The notation is defined in appendix A.
11. This is a heuristic approach based on Axnihud and Mendelson (1980). Their
derivation is optimal for a monopolistic market—maker facing a stationary
stream of market buy and sell orders arriving according to a Poisson process.
However, the two basic forces at work (narrowing the spread as the desired
27
inventory level is approached, and shading the quote in the direction of a
desired inventory movement) are more general. See Burnham (1991), pp. 133—6,
for additional analysis of the factors affecting the spread. In private
correspondence, he suggests that market—makers widen their spreads in the time
immediately prior to an anticipated news arrival, to discourage a last—minute
shock to inventory. This aspect of trading is not incorporated in the model.
The bid price is not allowed to exceed /3°+z = a’, because this would be
inconsistent with a trader who believed the market to be at (/‘3°,a°)and who
wanted to avoid being arbitraged. Similarly, the ask price is not allowed to
fall below a°—z= /3’. Spreads larger than five ticks are not allowed,
because, at some point, the dealer is perceived to be failing in her role as a
market—maker —- a spread of (0,cx) is equivalent to quitting the market —— and
would be asked to narrow her spread.
The spread-setting algorithm in table 1 requires some clarification.
Prices in the U. S. market for DEM are quoted European style (i. e., DEM/USD).
Spreads are concentrated at ten pfennigs per hundred dollars, with five— and
twenty—pfennig spreads also frequent but less common. Intermediate values (e.
g., .0009 DEM/USD) occur very rarely, so that .0005 DEM/USD becomes, at a
first approximatation, a de facto tick size. The failure of market—makers to
exploit finer gradations of the spread remains an unanswered puzzle; Goodhart
and Figliuoli (1991), pp. 28—29, attribute it to a form of bounded rationality
dubbed the “round number syndrome”. In the model here, however, all prices
and spreads are stated in American terms (USD/DEM), because the intradaily
bid-ask spot price data used to validate the simulation model were obtained
from the Philadelphia stock exchange (PHLX), which prices its foreign currency
options American style (e. g., the quote 1.8910-20 would appear on the PHLX
tape as “5288 5285”). This conversion compresses spreads, and the empirical
distribution of spreads when prices are converted to American terms is
unimodal. The mode is two ticks (i. e:, .0002 USD/DEM; see also appendix B),
the mean is .000266 USD/DEM, and more than 95% of the observed spreads are
five ticks or less.
28
12. This approach, including the lack of serial correlation in changes in
desired inventory, is consistent with Ho and Stoll (1983, pp. 1066—67). They
define dealer m’s inventory discrepancy (“net unwanted inventory”, in their
parlance, p. 1067) as ‘m — m/(R0
2
), where m’s desired inventory is
Em/(Ro
2
) a I~, and where 02 and R are both exogenous constants. The one
difference between their approach and that used here is that, for Ho and
Stoll, the sum across all dealers of Em —— and thus of I~a Em/(R02) —— is
always zero by construction: Em is the deviation of m’s opinion of the true
price from the average such opinions. In the simulations here, on the other
hand, the sum across market—makers of the I~is not identically zero, but
rather zero in expectation. Note that, in both specifications, desired
inventory is unaffected by price information: Em changes only with a change
in fundamentals.
13. Given two uniform U(0,1) random variables, u1 and u2, a triangular
integer random variable, 4~
— ~{—P,...,P}, is generated as: I~t=
t[u1(P+lflI + j[u2(P+1)]t — P , where j[•)~ is the greatest integer function and P
is some positive integer. For example, subtracting 7 from a roll of two
standard six-sided dice would yield a i~{-5,...,5}deviate.
14. This is a simplification. Owing to the difference in the way brokers’
quotes and market—makers’ quotes arise, it may be reasonable for market—makers
to interpret their information differently. Precisely modelling such a
difference in interpretation would be exceedingly complex, however.
15. Burnham (1991), pp. 136—7, confirms that customers who regularly engage
in arbitrage or short-term position-taking will be required by their
correspondent banks to reciprocate by making a market themselves. Thus, by
definition, customers are precluded from considering short—term dynamics.
16. Taylor (1989) finds significant and persistent violations of covered
interest parity in the London foreign exchange market. Similarly, Rhee and
Chang (1992) find rare instances of covered interest parity violations, and
more significant opportunities for “one—way arbitrage”.
29
17. This point is always feasible in the model, because desired inventories
are bounded by the position constraints, while customers provide an
essentially unbounded pool of currency on both sides of the market. This is
noteworthy, because it contradicts the familiar axiom of nonsatiation, and
thus allows a measure of allocational inefficiency that differs from the
standard notion of Pareto—efficiency.
18. There are some limits to the application of this argument. Roll (1984),
for example, shows that the existence of a double—auction protocol is
sufficient to induce negative serial correlation in changes in transaction
prices (sometimes called “bid—ask bounce”) in a stable efficient market. Fama
(1970), on the other hand, argues that correlation patterns in security prices
are usually small enough to be swamped by the spread and transaction costs, so
that profitable trading algorithms are still not possible, even if pure price
efficiency is not achieved. Cohen, Maier, Schwartz, and Whitcomb (1978) also
cite this argument, and they provide several other reasons why “serial
correlation patterns in transaction returns provide only limited evidence
regarding market efficiency” (pp. 725—6). Goodhart and Figliuoli (1991) and
Wasserfallen (1989) find evidence of significant negative serial correlation
in exchange rates.
19. This clearly does not cover all possible predictable patterns. See Fama
(1970), p. 392, note 10, for a simple counterexample. The market efficiency
coefficient of Hasbrouck and Schwartz (1988) uses a weighted average of
correlation coefficients at several lags. Their construction requires an
assumption of Brownian motion, however, which allows the aggregation of lagged
autocorrelations; see Schwartz (1988), pp. 361—2.
20. For a discussion of experimental designs in computer simulations, see
Naylor, Burdick and Sasser (1967). For a description of response—surface
designs see Khuri and Cornell (1987).
21. The choice of a second—order Taylor series to approximate the true
response surface is not entirely arbitrary. Implicit in its use are the
30
presumptions that true response functions are smooth, and that the effect of
lower order terms dominates that of higher order ones. Both assumptions are
reasonable implications of what Simon (1963) calls the “principle of
continuity of approximation” (pp. 230—1). The Taylor series is truncated at
the second—order terms to mitigate multicollinearity problems among the
numerous terms in same experimental variables.
22. The partial derivatives calculated from the Tobit regressions of the
third inefficiency measure are slightly tricky, because a number of such
partial derivatives can be calculated from the regression results. For
example, one can calculate the partial derivative for the underlying model, or
the partial derivative conditional on the dependent variable being at a nonlimiting
value; see Maddala (1983), p. 160.
23. For example, Taylor (1989), p. 388, argues: “The second finding is quite
intuitive and uncontentious. One would expect the efficiency of the
international foreign exchange and capital markets to have increased over time
with increases in the number market participants ...“ He also attributes part
of the improvement in efficiency to advances in information technology. Stoll
(1978) addresses directly the relative advantages of monopolistic and
competitive dealer microstructures. For statements of the traditional view,
see Stigler (1964), p. 129, and Garbade (1978), p. 497.
24. In interpreting the results, keep in mind that inefficiency is being
measured: a negative partial derivative means an increase in the experimental
variable tends to improve market performance. This difference in signs on
partial derivatives for the same experimental variable is consistent with an
equilibrium market structure, which should balance trade—off s between
different types of inefficiency.
25. For the incautious model, 178 of the 300 observations (59 percent) are at
the limiting value of 1000; for the cautious model the figure is 182 (61
percent). Normalized coefficients, as described by Maddala (1983), pp. 156—8,
can be obtained by dividing the non—normalized coefficients (and their
31
standard errors) by the standard error of the regression estimate, which is
473.6 for the incautious case, and 645.5 for the cautious case.
26. Brooks (1985), p.25, describes submitting a limit order as “sticking out
the chin so as to be acquainted with the moment that the fight starts.”
27. In interpreting the numbers in tables 5 and 6, keep in mind that the
number of customers, C, is the number of customers active in the market in
every period, not the total number of customer orders per day.
28. See BIS (1989, 1990a) and Duncan (1991). Netting procedures lower
processing and accounting costs, and they can reduce counterparty exposure
risks. Among current proposals, FXNET is a communications network that allows
bilateral netting of payment orders; ECHO and NACHO are clearing house
organizations that provide for multilateral netting of payments and
counterparty substitution of the clearing house into all trades.
29. Existing and proposed services are either for informational purposes only
(e. g., Quotron’s FXQuote and Telerate pages 263-4), or they per.form a
brokerage function, that is, they accept only limit orders, rather than
market—makers’"
You are talking abaut good old fashion martingale and with a 10% winratio i can say at once you will bust because with that winrate you could easily go on 30 straight losses and then you would have busted the available lotsize you start with 0.01 then 0.02 and then you go 0.04-0.08-0.16-0.32-0.64-1.28-2.56-5.2 and then 10.4 that is 11 losses straight and even with a 50/50 winratio this can happen and that will dig into your account bigtime.
Ignored
if martingale only has 10% chances accurate is what you meant, i disagree.
By using the Martingale strategy, the number of lots opened after experiencing a defeat must be 2 times more than before (the number of lots is always 1 step ahead of the previous defeat so that if you win then the previous defeat can be closed and get profit). Viewed in theory, price movements will not forever go in one direction, will definitely experience a reversal, so that Martingale strategy users will definitely win.
Joined Oct 2015
|
Status: Focused on the Results
|1,477 Posts
There are strategies that exist that is based on an edge which gives confidence to the trader utilizing that particular strategy however there has to be a systematic way of accomplishing this in a consistent manner. This means that anyone who uses the same approach should experience the same result if the approach is systematic.
When persons reach this state in trading/ investing... The confidence increases in a way they can charge for their expertise through services like fund management, copier or signal services. These persons will continue to grow because new traders are taking the short cut to trading success by just going straight to the source. They will pay from $30 to $500 On average per month rather than lose thousands over a period, instead the opt to make this instead by investing in a servic, product or education. In those favourable scenarios everyone benefits.
The question now is how much are persons willing to pay, whether through product, service or time to research. Some people take years to move from being consistent in making a loss, then to breakeven then profitability. New traders think about how much they can earn while professionals are concerned with the risk at hand first then look at the potential for targets or possible exits. When they have that in check anything away from a loss is good, even breakeven.
{quote} if martingale only has 10% chances accurate is what you meant, i disagree. By using the Martingale strategy, the number of lots opened after experiencing a defeat must be 2 times more than before (the number of lots is always 1 step ahead of the previous defeat so that if you win then the previous defeat can be closed and get profit). Viewed in theory, price movements will not forever go in one direction, will definitely experience a reversal, so that Martingale strategy users will definitely win.
Ignored
I agree with Voketexpert. Take EUR/USD, the highest martingale loss reached 7000 pips. Now, you could take 7000-pipscale as a martingale rule. Naturally, we shouldn't assume in the future 7000 will not be crossed, so fingers crossed netto profit have reached that far we could handle even that, which now seems, unlimited but managable. Aggressive martingale it too risky and feared by its high DD. So, that about classic martingale.
No one in this thread will use classic martingale. If martingale is used, he will apply smart martingale. Agreed?
- since martingale is essentially month-trading, use a swap-free account
- increasing winners over losers (namely by adjust RR)
- by trading in the direction of main trend or at least the news
- avoiding deadzones and slowing down loss by averaging, hedging, (digital) filters, DNN (advanced: Law of Numbers/averages, structure analyses, adaption, vhf, ds, quantile levels, newest prices/averages, CFB, DSL, QQE, FL, ML, DMT, FD)
@voketexpert, @magne999, @princeJ58 and all reading this:
Is this an edge in martingale? "Use arrow martingale instead of grid martingale." (based on bands cross, MA cross, oscillator cross)? Yes or no? And why or why not?
There are strategies that exist that is based on an edge which gives confidence to the trader utilizing that particular strategy however there has to be a systematic way of accomplishing this in a consistent manner. This means that anyone who uses the same approach should experience the same result if the approach is systematic..
Ignored
Interesting! I agree, reaching the same result is based on a clear approach with one meaning. I agree, there are definitely edges in the forex market, for example by looking at the structure, timing and news. You stated "there exist strategies based on edges." Is this your experience? In your opinion, what does an edge distinguish from random luck?
{quote} Interesting! I agree, reaching the same result is based on a clear approach with one meaning. I agree, there are definitely edges in the forex market, for example by looking at the structure, timing and news. You stated "there exist strategies based on edges." Is this your experience? In your opinion, what does an edge distinguish from random luck?
Ignored
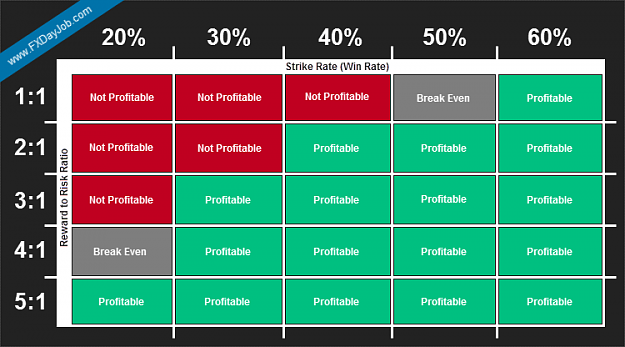
An edge is knowing that out of every 10 trades you take you will win 5 at 3:1 or win 2 at 5:1. Which in the end will work out to be profitable however the risk has to be the same all the time or calculated the same way all the time not just random places.
{quote} An edge is knowing that out of every 10 trades you take you will win 5 at 3:1 or win 2 at 5:1. Which in the end will work out to be profitable however the risk has to be the same all the time or calculated the same way all the time not just random places. {image}
Ignored
Thank you so much! Let's take 3000 trades in 3 years with 5:1 RR that has a 30% winrate. It could be an edge, and that is ideal. What if it's random luck and you want to know which of the two seems to be the case?
MagoBranco added a valuable remark in another active thread:
1. Trade a weak currency against a strong one or vice-versa.
So far, the USD is mainly strong. The FED maintained the interest rate at 2% and forecast that they will gradually raise it. They are now comfortable with the inflation and the majority of performance indicators are pointing up.
Now look for a weak currency, like the British Pound or the Australian Dollar.
2. Fundamentals dictate the direction of the market.
Supply and demand and interest rates are the most important when talking about depreciation or appreciation of a currency.
Banks have huge stockpiles of cash sitting around, but they want to make a profit from it, or at least keep up with inflation, so they will look for the best currency for the job, one that gives the best interest rate/loss from inflation ratio, but at the same time get satisfied with economical stability.
3. Technicals are mostly bullshit.
No hedge fund manager or bank trader gives a f*** about your cup whatever pattern or your stupid favorite oscillator. If the fundamentals point up, they will buy in, and all smart money too. That increases demand, and if supply don't keep up, prices go up. Simple as that.
I've seen the price pump 80 pips in 2 minutes before the release of some important statistical data that was expected to be bad. That is caused by people that had shorted and were unsure about the numbers that would come out, they closed their positions and waited to be sure, making the price go up because they bought back to close their shorts, and only after the statistic thing was published they when short again.
The point is that the price may go up or down because of technicals, but only if the fundamentals match that direction. Its like "oh, things look bad for AUD, but there is a support line there and the price is going up because people are uncertain about this data that is about to get released, maybe I should wait until I short AUDUSD so I can maximize my profits and tighten my stop".
So don't all in just because of some stupid pattern or breakthrough.
4. Trade with the trend.
Don't trade breakouts or channels. There are better alternatives.
If the price is flatted, its because both currencies are strong or weak and there is an agreement (more like a settlement) about the price, so the only thing moving it is speculation, and God knows what else...
Its much better to trade something more decisive and certain.
5. Technical indicators
I've mentioned that most technical analysis is bullshit. Well, most of it, but not all of it.
I personally use moving averages and On-balance Volume.
The 30 and 50 periods simple moving average have proven themselves to be support or resistance lines with time, at least to me. If the price bounces and continues the trend after touching the 30, from in between the 30 and 50 or after touching the 50 MA, you can consider it as a trend, even if there is no concrete trend line established. If the price goes past the 50 MA, abandon that pair and find another one.
On-balance volume is pretty simple to understand. It tracks volume. Its a reliable indicator to better understand if some movement or trend has substantial volume backing it. Google about OBV.
6. Confluence and risk management
If there is confluence, if the price is close to hitting a fibo level, and its inside the MA mentioned above, plus there is a trend line, or even a round number, then technicals indicate like the price will bounce from those resistance levels. But what about the fundamentals? If your fundamental analysis also point to a continuation of the trend (like if you were waiting for some important data to be released), its a good idea to buy in or short after the fundamentals "concur" with the technicals.
Risk no more than 1 or 2 percent of your account, Set your stop above those resistance levels and give it some extra room too, and set your TP to about 80% of the size (in pips) of the last impulsive wave (the one that move in the direction of the trend), and try to find some round number or past resistance/support level from stronger longer-term periods so your TP is before that level, just to be sure.
{quote} I agree with Voketexpert. Take EUR/USD, the highest martingale loss reached 7000 pips. Now, you could take 7000-pipscale as a martingale rule. Naturally, we shouldn't assume in the future 7000 will not be crossed, so fingers crossed netto profit have reached that far we could handle even that, which now seems, unlimited but managable. Aggressive martingale it too risky and feared by its high DD. So, that about classic martingale. No one in this thread will use classic martingale. If martingale is used, he will apply smart martingale. Agreed?...
Ignored
Technique was established for them who will to take risk for money.
It depends on you how you play it untuil profit.
I'm only slowing down the loss, while the risk of losing stays the same. The crux is to be lucky enough that when you arrive at the deadzone you already earned back that money in the first phase.
Joined Oct 2015
|
Status: Focused on the Results
|1,477 Posts
5:1 don't come often, 3:1 is easier...just know this whatever risk to reward you choose ensure that it goes hand in hand with your win rate percentage.
Joined Oct 2015
|
Status: Focused on the Results
|1,477 Posts
5:1 don't come often, 3:1, 2:1, 1:1 is easier...just know this whatever risk to reward you choose ensure that it goes hand in hand with your win rate percentage. The smaller it is the more accurate you need to be...
Joined Oct 2015
|
Status: Focused on the Results
|1,477 Posts
See when you just start it's easy to do fancy spreadsheets and do easy calculations of percentages, however the hard part is getting to the place where the strategy is perfect for the dream or goal.
See when you just start it's easy to do fancy spreadsheets and do easy calculations of percentages, however the hard part is getting to the place where the strategy is perfect for the dream or goal.
Ignored
Thank you so much. Assume I optimize testing only to realise that 5:1 has a proper winrate. How can I check it's not random luck?