Hi there,
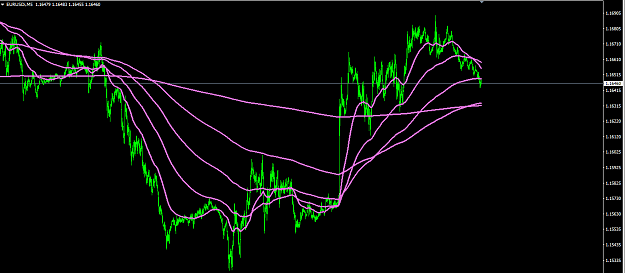
I use the 5M chart with the 50 EMA and would like to add the 50 EMA onto the 5M from the 15M, from the 30M, from the 1H, 4H and daily.
Does anyone know which periods I have to use for each to add a 50 EMA from other timeframes on the 5M?
Thanks a lot!
I use the 5M chart with the 50 EMA and would like to add the 50 EMA onto the 5M from the 15M, from the 30M, from the 1H, 4H and daily.
Does anyone know which periods I have to use for each to add a 50 EMA from other timeframes on the 5M?
Thanks a lot!