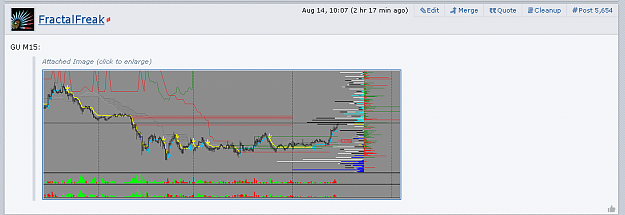
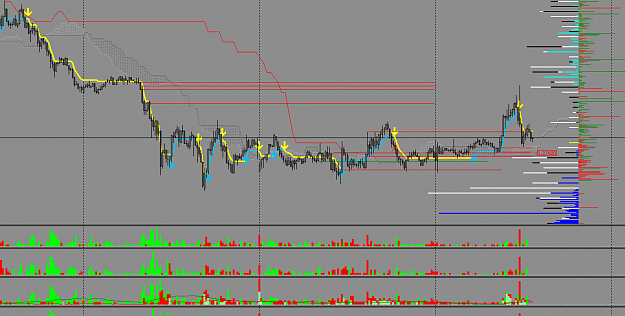
Disliked{quote} what does the GU chart mean, stops above or below greater?Ignored
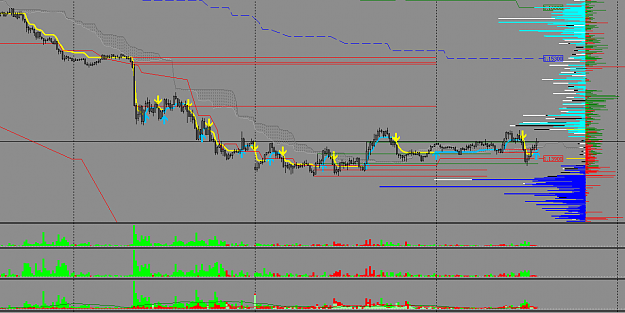
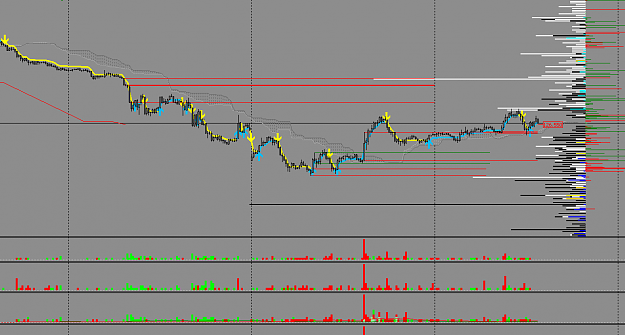
Looks like you just came into this thread. FF will def tell u to go to the beginning and see the videos and read as much as possible to follow easier. Takes work. However in simple terms, the black & white stops above price on that chart have just now been taken out with a long wick. That took out the older stops as well that had hopped onto shorts too soon. The lines below are the longies stops which will act over a period of time, as magnets for the algos to send price down. Just watch it all happen live on your screen. The 1st histo there is showing the new green longies coming in so they will be out with a short move down but the SM have alot of news out today to take advantage of. Keep watching the bloodbath.
1