{quote} Thank u Inthebox, under what situation we cancel the set ups? I read some of the threads some traders said they missed the set up.
Ignored
does not matter whether price moves up or down the setup, it is still valid and not cancelled because going forward price might revisit the setup line again.
the set up is only temporary ignored when price closes below a buy set up or above a sell setup.
later if price closes above the same buy set up, it is still valid.
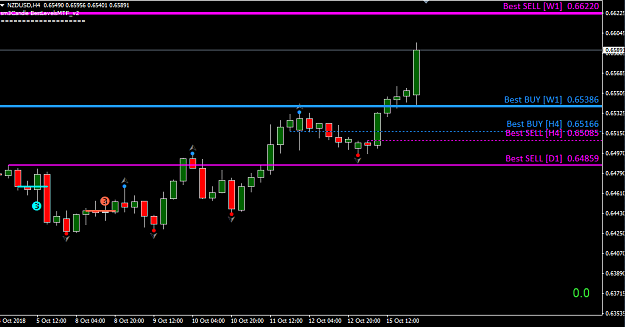
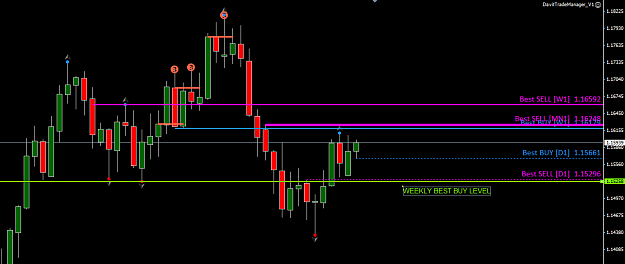
I'm not sure why, but this weekly best buy level was missed on EU (week of Sept 9th). This would be very important information for the LONG decision this week. Last Week's Weekly bar close also gave enough information to go long at this level, so that "old" level would be very relevant to the current trading range and week.
Hi SwingMan, I'm not sure why, but this weekly best buy level was missed on EU (week of Sept 9th). This would be very important information for the LONG decision this week. Last Week's Weekly bar close also gave enough information to go long at this level, so that "old" level would be very relevant to the current trading range and week. {image}
Ignored
I'm trying to program the history.
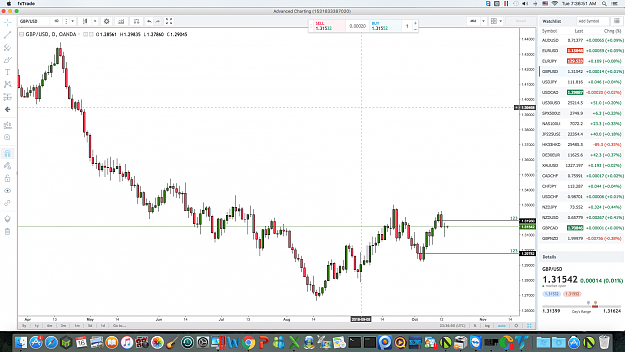
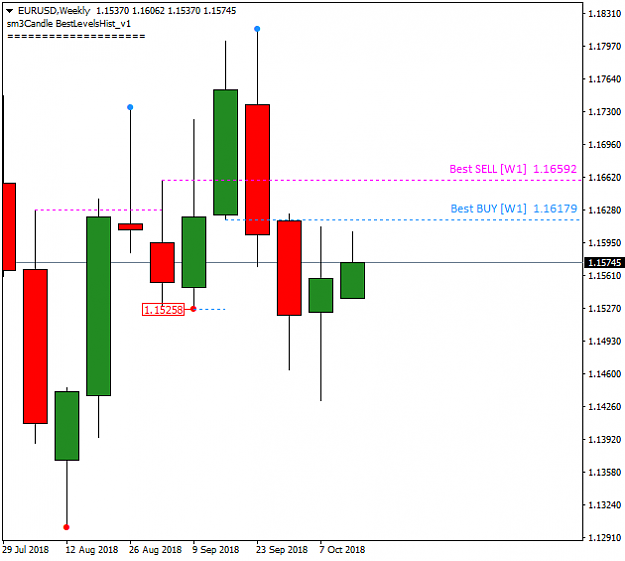
Bet BUY Level is available in your Chart. Check the values.
{quote} I'm trying to program the history. Bet BUY Level is available in your Chart. Check the values. {image}
Ignored
I see the level for the current swing, but look at the Swing high next to the current. That's the one I'm referring to which would be history. I guess you're saying that you're still working on that?
Hi SwingMan, I'm not sure why, but this weekly best buy level was missed on EU (week of Sept 9th). This would be very important information for the LONG decision this week. Last Week's Weekly bar close also gave enough information to go long at this level, so that "old" level would be very relevant to the current trading range and week.
Ignored
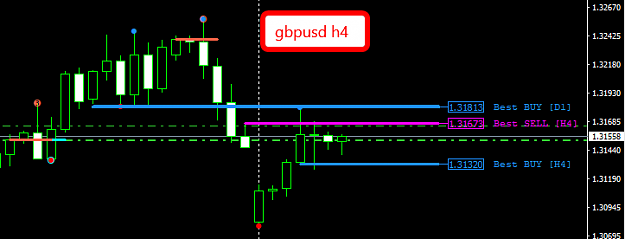
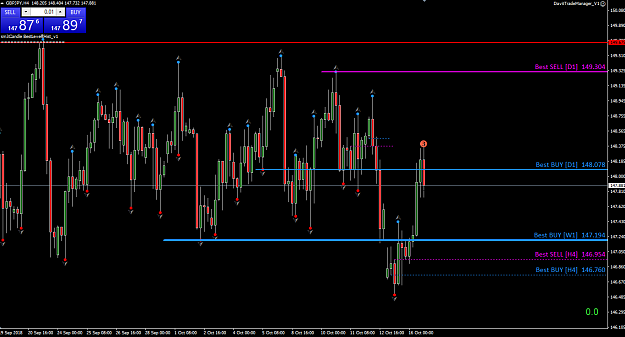
Here is a first version with "historical" levels, and I think that for W1 the BUY level is displayed correctly (please test).
Currently only works for the current time frame.
For easier testing, set the parameter "Draw_UpperTF_BestLevels" to true or false.
{quote} Here is a first version with "historical" levels, and I think that for W1 the BUY level is displayed correctly (please test). Currently only works for the current time frame. For easier testing, set the parameter "Draw_UpperTF_BestLevels" to true or false. {image} {file}
Ignored
Thank you SwingMan. Will do. I think you misunderstood my post. I was not saying that your W1 level was incorrect. I was just say that the level you now have marked in the new update was missing.
I thought your last version had addressed this issue.
... I think you misunderstood my post. I was not saying that your W1 level was incorrect. I was just say that the level you now have marked in the new update was missing. I thought your last version had addressed this issue. Thanks.
Ignored
If I do not understand what you mean, that's no problem for me.
My wife has been saying for years that I can not understand the women ...
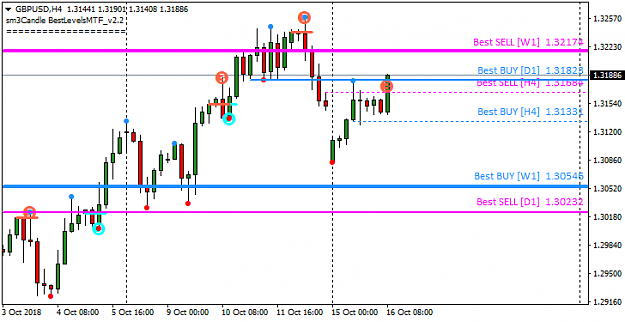
What on can do is e.g.
- to show only the last, or only the penultimate levels.
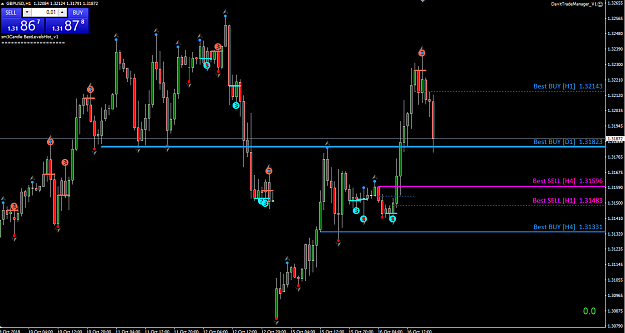
- or, if the last levels are displayed in the same way as in my chart, on should also draw the penultimate lines with lines to the right
- or on can draw the historical levels as a stair line
{quote} If I do not understand what you mean, that's no problem for me. My wife has been saying for years that I can not understand the women ... What on can do is e.g. - to show only the last, or only the penultimate levels. - or, if the last levels are displayed in the same way as in my chart, on should also draw the penultimate lines with lines to the right - or on can draw the historical levels as a stair line
Ignored
The Last Option sounds more feasible SwingMan "draw the historical levels as a stair line"
OR
Consider making them W1 BEST BUY, W2 BEST BUY, W3 BEST BUY etc. If that can work. The principle is that:
the strongest buy level for the next few hours is the H1x BEST BUY that price is now at
the strongest buy level for the current session is the H4x BEST BUY
for the today Dx, for this Week Wx
...The Last Option sounds more feasible SwingMan "draw the historical levels as a stair line" OR Consider making them W1 BEST BUY, W2 BEST BUY, W3 BEST BUY etc. If that can work. The principle is that: the strongest buy level for the next few hours is the H1x BEST BUY that price is now at the strongest buy level for the current session is the H4x BEST BUY for the today Dx, for this Week Wx
Ignored
Stair line
Is feasible, but did not like you ...
H1x, H4x, D1x, W1x
To see better the levels, I think on have to draw the lines to the right edge. But on should not write any additional texts because on can not distinguish them!
I see that you need an additional upper level:
Example: (for H1) H4, D1, W1
{quote} Stair line Is feasible, but did not like you ... H1x, H4x, D1x, W1x To see better the levels, I think on have to draw the lines to the right edge. But on should not write any additional texts because on can not distinguish them! I see that you need an additional upper level: Example: (for H1) H4, D1, W1
Ignored
Ok SwingMan...however you see it best to represent the levels.