Hello Traders,
I would like to share here how I approach the markets. I am from Germany, I used to traded for one local prop firm. I mostly scalp futures contracts, but I do trade forex as well, that’s why I am creating this thread. I will share here how I approach Dax, which is now really popular and thanks to the cfd is affordable.
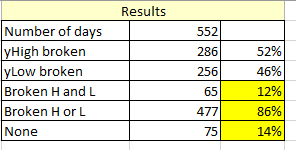
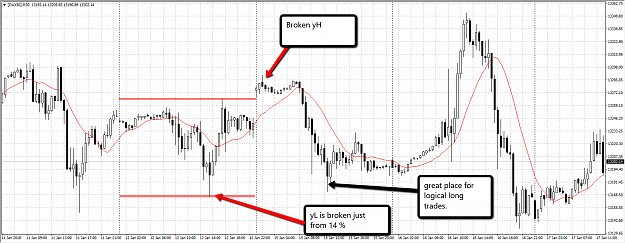
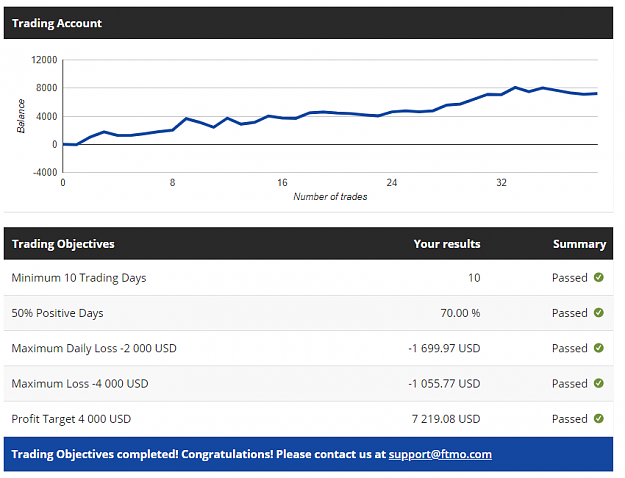
My forex trading is based on simple probabilities, which I will share here with you. I hear all the time that certain set up has higher probability of X %, but retail traders have no idea, what does it mean. I will try to post my trades and the logic behind them. In order to diversify my trading accounts I am undertaking the challenge from ftmo.com. I will also post my excel sheets with calculated studies. For most of you it is going to be super boring, for some, it might be interesting .
.
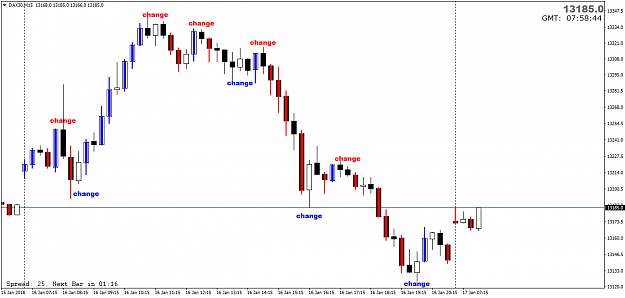
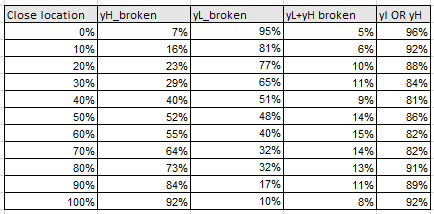
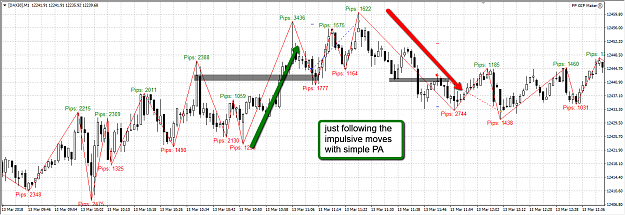
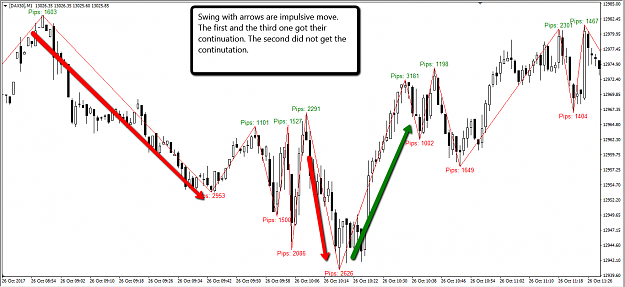
How I trade in a nutshell? I am using a ZigZag indicator (programmed for me by my friend) to find impulsive moves, impulsive move is a move which happens just in 27% of time. I have done excessive studies on this subject. I have found that on 1MIN TF are impulsive moves from 25+ points. As soon as impulsive move forms I am waiting for a correction to enter in a direction of the continuation move. The continuation happens in about 70 % of the time. As soon as the correction gets below the mid of the move, I am usually out, because just 19 % of these impulsive moves gets the continuation, but it depends on the situation.
I would like to share here how I approach the markets. I am from Germany, I used to traded for one local prop firm. I mostly scalp futures contracts, but I do trade forex as well, that’s why I am creating this thread. I will share here how I approach Dax, which is now really popular and thanks to the cfd is affordable.
My forex trading is based on simple probabilities, which I will share here with you. I hear all the time that certain set up has higher probability of X %, but retail traders have no idea, what does it mean. I will try to post my trades and the logic behind them. In order to diversify my trading accounts I am undertaking the challenge from ftmo.com. I will also post my excel sheets with calculated studies. For most of you it is going to be super boring, for some, it might be interesting
How I trade in a nutshell? I am using a ZigZag indicator (programmed for me by my friend) to find impulsive moves, impulsive move is a move which happens just in 27% of time. I have done excessive studies on this subject. I have found that on 1MIN TF are impulsive moves from 25+ points. As soon as impulsive move forms I am waiting for a correction to enter in a direction of the continuation move. The continuation happens in about 70 % of the time. As soon as the correction gets below the mid of the move, I am usually out, because just 19 % of these impulsive moves gets the continuation, but it depends on the situation.
Attached Image (click to enlarge)