• Home
  • Forums
  • Trades
  • News
  • Calendar
  • Market
  • Brokers
  • Login
  • Join
  • 2:17am
Menu
  • Forums
  • Trades
  • News
  • Calendar
  • Market
  • Brokers
  • Login
  • Join
  • 2:17am
Sister Sites
  • Metals Mine
  • Energy EXCH
  • Crypto Craft

Options

Bookmark Thread

First Page First Unread Last Page Last Post

Print Thread

Similar Threads

Statistical Probability Trading With Price Action 576 replies

EURJPY Trade Journal-Price Action (Sarawak-made) 10 replies

GbpUsd Statistical Probability With Price Action 109 replies

GbpJpy Statistical Probability With Price Action 22 replies

  • Trading Discussion
  • /
  • Reply to Thread
  • Subscribe
  • 42
Attachments: EurJpy Statistical Probability Trading With Price Action
Exit Attachments
Tags: EurJpy Statistical Probability Trading With Price Action
Cancel

EurJpy Statistical Probability Trading With Price Action

  • Last Post
  •  
  • Page 1 2 3
  • Page 1 2 3
  •  
  • Post #1
  • Quote
  • First Post: Oct 7, 2007 3:42pm Oct 7, 2007 3:42pm
  •  goodthings
  • Joined Aug 2006 | Status: Member | 1,852 Posts
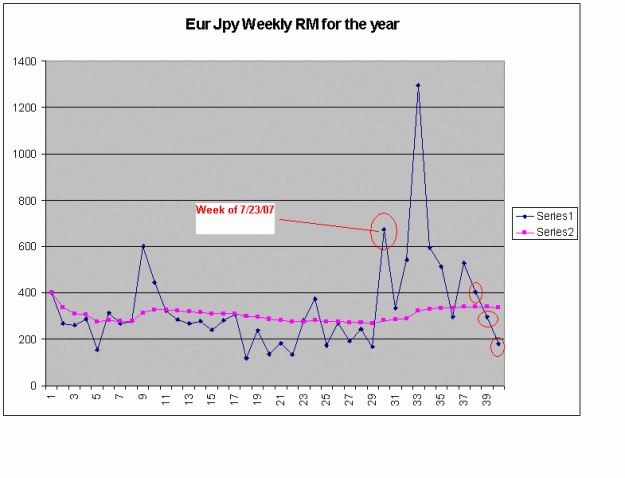
The weekly RM for the EurJpy has been lower three weeks in a row should see some good RM this week.

The blue line is the (RM) range of motion based on each weeks high and low for all the weeks of the year. The pink line is the (WAR) weekly average range. The (WAR) changes from week to week because it is the average of all the previous weeks to date. For instance week 4 (WAR) is based on adding the total number of pips a currency has range for the 4 weeks and dividing it by the four weeks. For instance say the (RM) for week 1 is 200 week 2 is 250 week 3 175 week 4 is 225. You would add 200+250+177+225=852 pips / by 4 weeks equal an (WAR) for the first 4 weeks of 212. This is how each weeks(WAR) is calculated.
Attached Image (click to enlarge)
Click to Enlarge

Name: Weekly Range Chart.GIF
Size: 12 KB
  • Post #2
  • Quote
  • Oct 7, 2007 3:44pm Oct 7, 2007 3:44pm
  •  goodthings
  • Joined Aug 2006 | Status: Member | 1,852 Posts
WAR for various periods of time.
Attached Image (click to enlarge)
Click to Enlarge

Name: Weekly Range Of Motion.GIF
Size: 11 KB
 
 
  • Post #3
  • Quote
  • Oct 7, 2007 4:30pm Oct 7, 2007 4:30pm
  •  goodthings
  • Joined Aug 2006 | Status: Member | 1,852 Posts
EurJpy DAR
Attached Image (click to enlarge)
Click to Enlarge

Name: DAR.GIF
Size: 15 KB
 
 
  • Post #4
  • Quote
  • Oct 7, 2007 5:44pm Oct 7, 2007 5:44pm
  •  goodthings
  • Joined Aug 2006 | Status: Member | 1,852 Posts
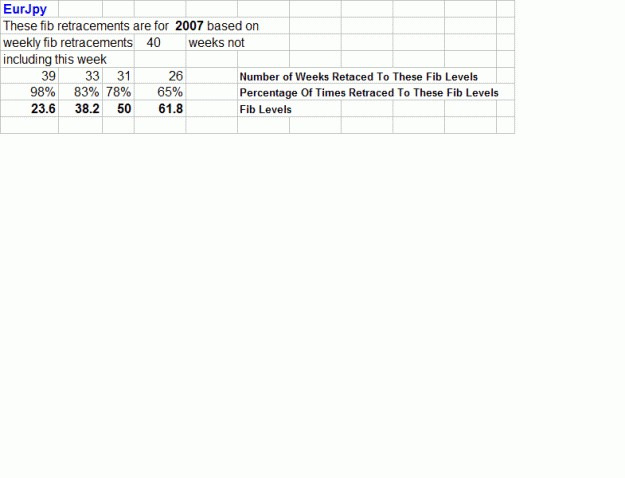
The EurJpy weekly fib retracements. In contrast the pound

98% to 23.6, 90% to the 38.2 fib, 80% to the 50 fib, and 64% to the 61.8 fib.

These fib calculations have a 10 pip tolerance. Meaning if it came within 10 pips or less to a fib level it was counted as a hit.
Attached Image (click to enlarge)
Click to Enlarge

Name: weekly fib retracement percentages.GIF
Size: 10 KB
 
 
  • Post #5
  • Quote
  • Oct 7, 2007 6:53pm Oct 7, 2007 6:53pm
  •  goodthings
  • Joined Aug 2006 | Status: Member | 1,852 Posts
(DR) probabilities EJ.
Attached Image (click to enlarge)
Click to Enlarge

Name: EurJpy Daily Range Probabilities.GIF
Size: 33 KB
 
 
  • Post #6
  • Quote
  • Oct 7, 2007 7:13pm Oct 7, 2007 7:13pm
  •  goodthings
  • Joined Aug 2006 | Status: Member | 1,852 Posts
EJ daily RM the last three weeks is showing more weakness then the gbpusd and gbpjpy. See post 3 for DAR.
Attached Image (click to enlarge)
Click to Enlarge

Name: RM 40 Days.GIF
Size: 12 KB
 
 
  • Post #7
  • Quote
  • Oct 7, 2007 7:14pm Oct 7, 2007 7:14pm
  •  goodthings
  • Joined Aug 2006 | Status: Member | 1,852 Posts
EJ (RM) the last 41 to 80 days.
Attached Image (click to enlarge)
Click to Enlarge

Name: RM 41 to 80 Days.GIF
Size: 12 KB
 
 
  • Post #8
  • Quote
  • Oct 7, 2007 7:59pm Oct 7, 2007 7:59pm
  •  goodthings
  • Joined Aug 2006 | Status: Member | 1,852 Posts
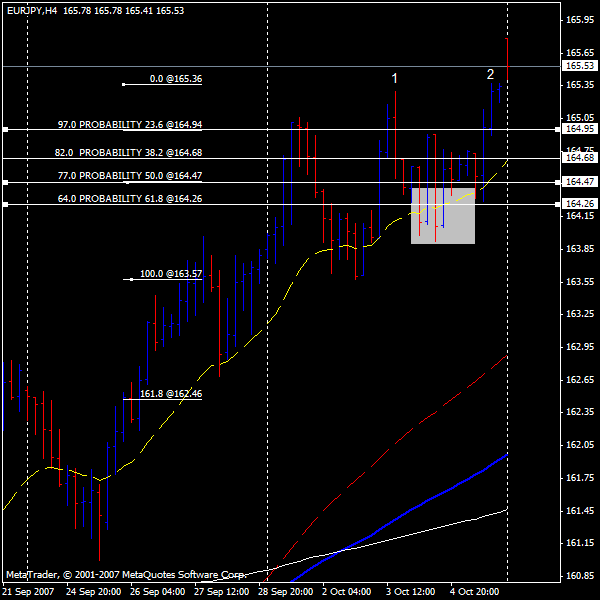
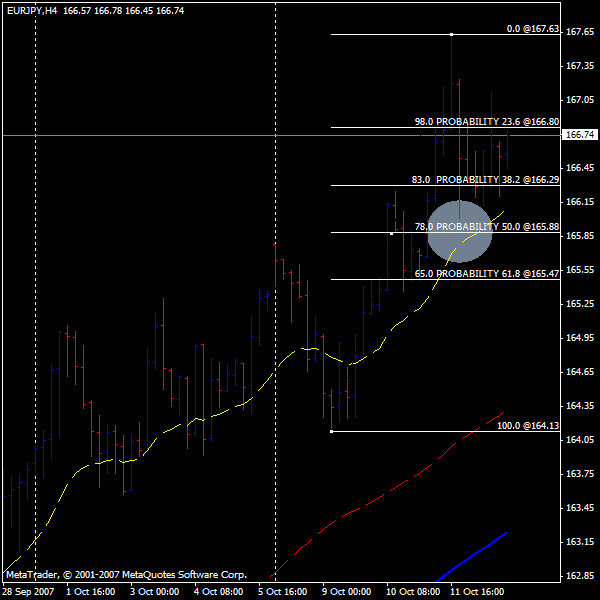
Possible support at these weekly fibs. One thing to note is point 1 was a high for the week and EurJpy did retrace beyond the 61.8 fib (see shaded areas) then went up and established a new high for the week. EurJpy also has had 4 straight weeks with a higher close. Post 4 shows compares the gbpusd weekly retracement percentages with the EurJpy.
Attached Image
 
 
  • Post #9
  • Quote
  • Oct 9, 2007 2:41am Oct 9, 2007 2:41am
  •  goodthings
  • Joined Aug 2006 | Status: Member | 1,852 Posts
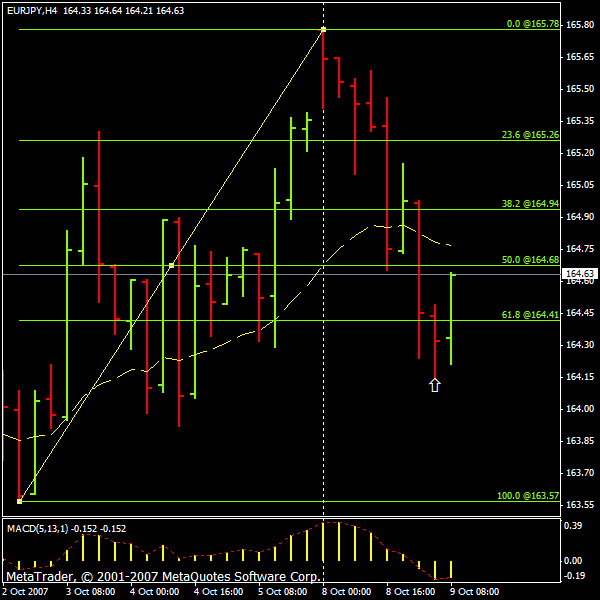
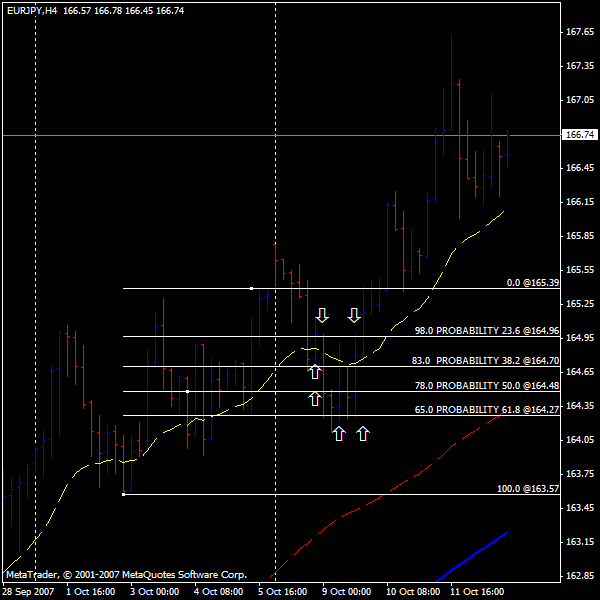
EurJpy is finding support 27 pips beyond the weekly fib of 61.8. See previous post for statistical probabilities (SP) for weekly retracements to these level. Its high and low is 164 pips with WAR for 2007 being 337 and yearly DAR 140 pips. Currently its daily RM is 84 pips. Yesterdays RM was 113 pips and all of last week its daily RM was low for the yearly average.
Attached Image
 
 
  • Post #10
  • Quote
  • Oct 9, 2007 2:47am Oct 9, 2007 2:47am
  •  goodthings
  • Joined Aug 2006 | Status: Member | 1,852 Posts
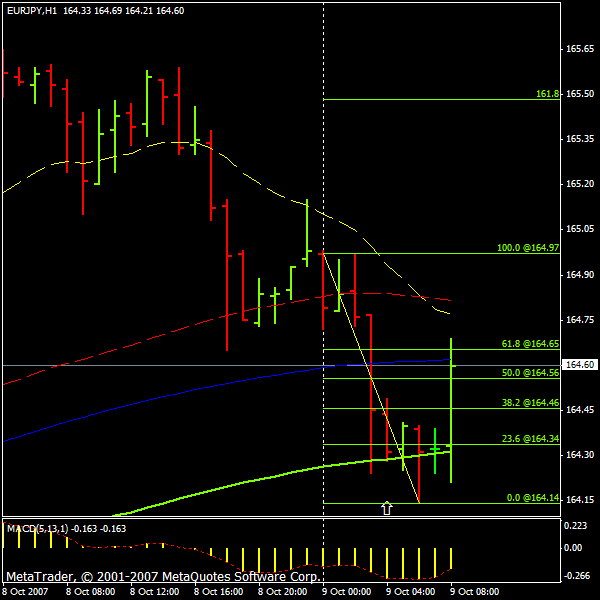
Currently on the daily it has retraced to 61.8 fib level at 164.65. Break above that and the days opening and high of 164.97 would indicate up swing. Breaking below 164.14 down side trend continues. Around 3am could give some indicators which way it is heading. 4hr candles bearish with current hourly supports holding.
Attached Image
 
 
  • Post #11
  • Quote
  • Oct 14, 2007 3:04pm Oct 14, 2007 3:04pm
  •  goodthings
  • Joined Aug 2006 | Status: Member | 1,852 Posts
EurJpy weekly fibs
Attached Image (click to enlarge)
Click to Enlarge

Name: weekly fib retracement percentages.GIF
Size: 10 KB
 
 
  • Post #12
  • Quote
  • Oct 14, 2007 3:08pm Oct 14, 2007 3:08pm
  •  goodthings
  • Joined Aug 2006 | Status: Member | 1,852 Posts
The eurjpy for the weekly fib has come with in 13 pips of 50 fib from last weeks high and low. See previous post for statistical probability (SP) percentages for weekly fib retracements. If it comes with in 10 pips of a weekly fib level its counted as a hit.
Attached Image
 
 
  • Post #13
  • Quote
  • Oct 14, 2007 3:18pm Oct 14, 2007 3:18pm
  •  goodthings
  • Joined Aug 2006 | Status: Member | 1,852 Posts
In post 8 for this past week it was noted the weekly fibs would be good s/r level to look at based on (SP) statistical probabilities. The EurJpy ranged between the 61.8 fib which held as bottom support and the 23.6 fib was a place of resistance until it broke to the high of 167.63. Since that high as mentioned in the previous posts it has retraced to within 13 pips of the 50 weekly fib levels.
Attached Image
 
 
  • Post #14
  • Quote
  • Oct 14, 2007 3:30pm Oct 14, 2007 3:30pm
  •  goodthings
  • Joined Aug 2006 | Status: Member | 1,852 Posts
The five week (WAR) compared to the 10 week (WAR) is leveling off to being closer to the yearly (WAR).
Attached Image (click to enlarge)
Click to Enlarge

Name: Weekly Range Of Motion.GIF
Size: 11 KB
 
 
  • Post #15
  • Quote
  • Oct 14, 2007 3:46pm Oct 14, 2007 3:46pm
  •  goodthings
  • Joined Aug 2006 | Status: Member | 1,852 Posts
In post 1 it was noted that the weekly RM was getting lower for the past 3 weeks and looking at the statistical probabilities (SP) it was highly probable for the RM to break out. As always the key to trading is knowing highs,lows, trends, and timing entries and exits.
Attached Image (click to enlarge)
Click to Enlarge

Name: Weekly Range Chart.GIF
Size: 12 KB
 
 
  • Post #16
  • Quote
  • Oct 14, 2007 10:07pm Oct 14, 2007 10:07pm
  •  goodthings
  • Joined Aug 2006 | Status: Member | 1,852 Posts
EurJpy
Attached Image (click to enlarge)
Click to Enlarge

Name: 4 DAR.GIF
Size: 10 KB
 
 
  • Post #17
  • Quote
  • Oct 14, 2007 10:17pm Oct 14, 2007 10:17pm
  •  goodthings
  • Joined Aug 2006 | Status: Member | 1,852 Posts
Daily RM the last 41 to 80 days.
Attached Image (click to enlarge)
Click to Enlarge

Name: 7 RM 41 to 80 Days.GIF
Size: 11 KB
 
 
  • Post #18
  • Quote
  • Oct 14, 2007 10:18pm Oct 14, 2007 10:18pm
  •  goodthings
  • Joined Aug 2006 | Status: Member | 1,852 Posts
Daily RM EurJpy the last 40 days
Attached Image (click to enlarge)
Click to Enlarge

Name: 6 RM 40 Days.GIF
Size: 13 KB
 
 
  • Post #19
  • Quote
  • Oct 14, 2007 10:35pm Oct 14, 2007 10:35pm
  •  goodthings
  • Joined Aug 2006 | Status: Member | 1,852 Posts
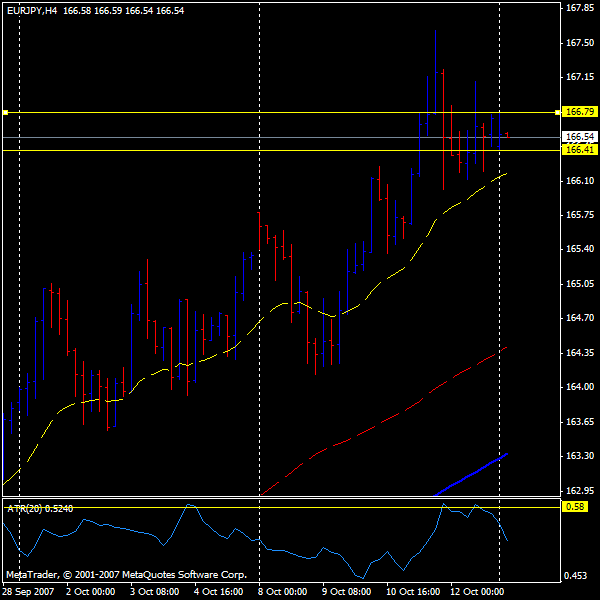
The daily RM for EurJpy the last 20 or so days has decreased compared to its RM between 20 and 60 days ago. It still has a higher RM compared to the previous 6 to 7 months of the year. So when looking at the daily (SP) chart you have to take in the balance of the all the three time frames I mentioned above, yearly,20 to 60 days, and the last 20 days. A high probability trade is around 70%,thus the yellow high lite, which is what a person has to consider when looking at a daily range. Looking at the last 5 days the RM has been 112,128,109,211, and 99. There is a high probability of the EurJpy having a 100 plus RM in the next couple of days. Currently it is ranging in a tight 40 pip range, which the first day of the week for most currencies has the lowest RM.
Attached Image (click to enlarge)
Click to Enlarge

Name: 5 Daily Range Probabilities.GIF
Size: 39 KB
 
 
  • Post #20
  • Quote
  • Oct 14, 2007 10:45pm Oct 14, 2007 10:45pm
  •  goodthings
  • Joined Aug 2006 | Status: Member | 1,852 Posts
It is currently about 266 pips below its high in July. Has room for a break out toward the upside before it hits uncharted territory.
Attached Image
 
 
  • Trading Discussion
  • /
  • EurJpy Statistical Probability Trading With Price Action
  • Reply to Thread
    • Page 1 2 3
    • Page 1 2 3
0 traders viewing now
  • More
Top of Page
  • Facebook
  • Twitter
About FF
  • Mission
  • Products
  • User Guide
  • Media Kit
  • Blog
  • Contact
FF Products
  • Forums
  • Trades
  • Calendar
  • News
  • Market
  • Brokers
  • Trade Explorer
FF Website
  • Homepage
  • Search
  • Members
  • Report a Bug
Follow FF
  • Facebook
  • Twitter

FF Sister Sites:

  • Metals Mine
  • Energy EXCH
  • Crypto Craft

Forex Factory® is a brand of Fair Economy, Inc.

Terms of Service / ©2023