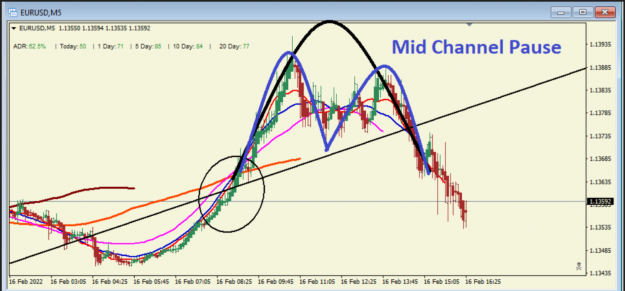
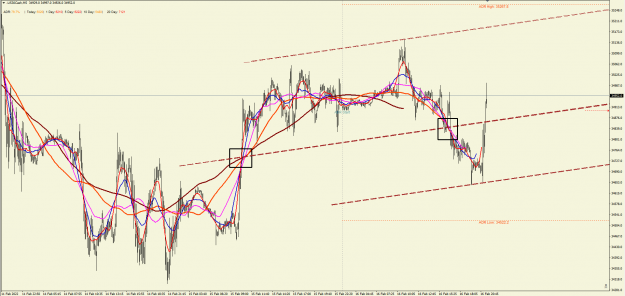
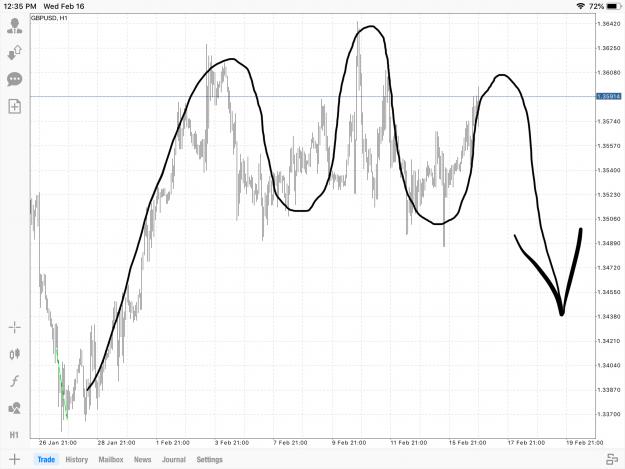
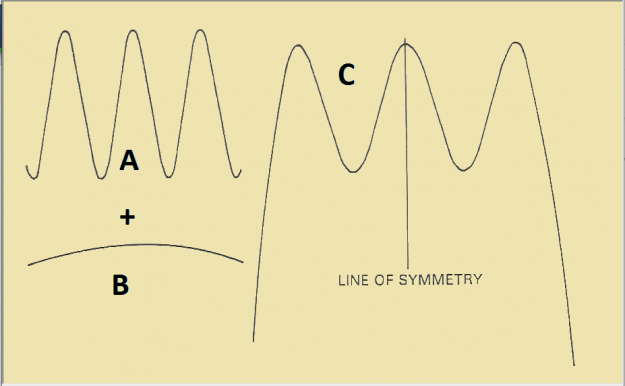
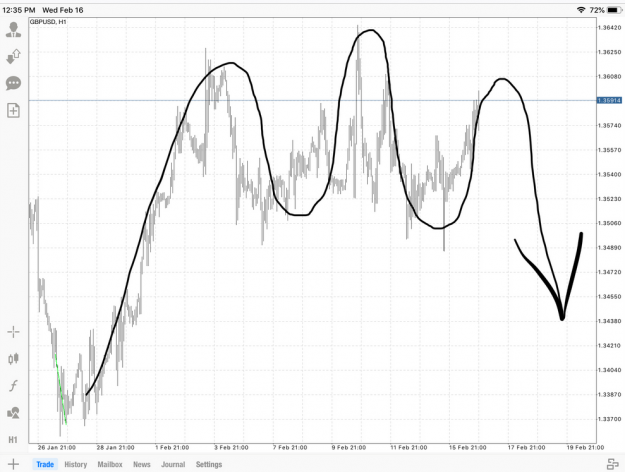
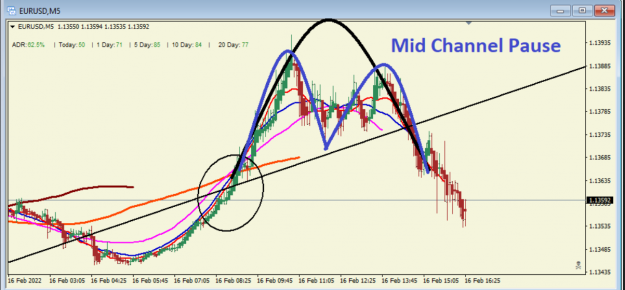
Understaning the Mid Channel Pause or the Straddle Trough
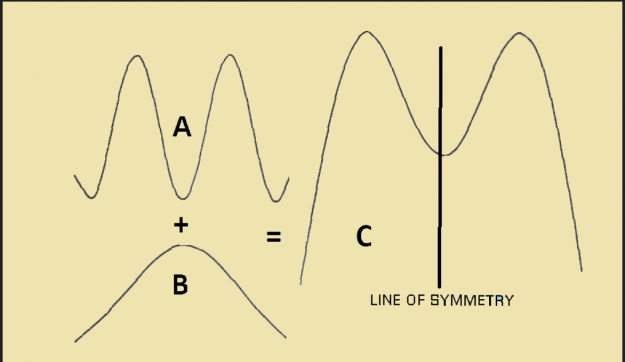
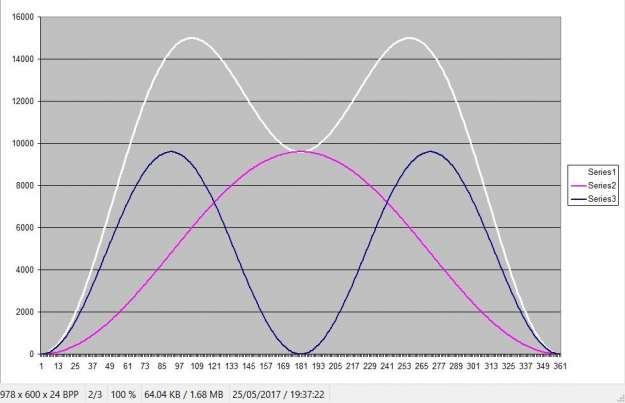
always refer to the theory for a better understanding of how Cycles generate Chart Patterns
always refer to the theory for a better understanding of how Cycles generate Chart Patterns
Attached Image(s) (click to enlarge)
2