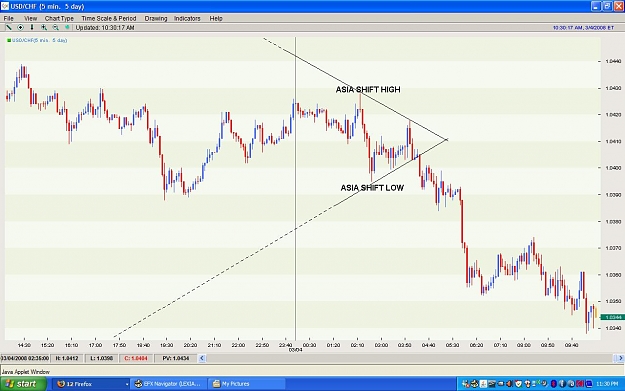
The average daily range is just another concept in technical analysis, it has been discussed in some threads here as well. It is probably under utilized . I find it complimentary to line drawing. Not wanting to go off topic, see how this recent triangle breakout can be taken with more confidence if you consider the following simple facts :
- USD/CHF typically averages more than 100 pips a day ( 24 hr period )
- above we have a triangle that breaks out of a 30 plus pip range during asian session, thus we can safely project a potential move in the direction of the break of at least 30 to 80 pips depending on how you manage your trade.
Mainly its about trying to feel the market, something like trying to predetermine whether if the break is worth taking, and if taken to what extend can you expect it to move ? Unfortunately there is no precise points to follow in this, only estimation. Practice is essential. Like aediaz1 uses fibs and pivots in conjunction with trendlines, I use this.
And of coz there are weekly , monthly , yearly ranges to consider too.
Simple ?
mARK
Ignored
Educational, Mark. The aspect you bring up here could tell you how big movement to expect from a break-out. I like your approach.
I'm gonna keep an eye open on some pairs to see how it works, I like the idea.
I have to admit, I've almost become blind of this aspect as I trade gbpjpy mostly. Since GJ could move 120 pips 1 day, and 500 pips the day after, I haven't been able to make any good "system" out of it.
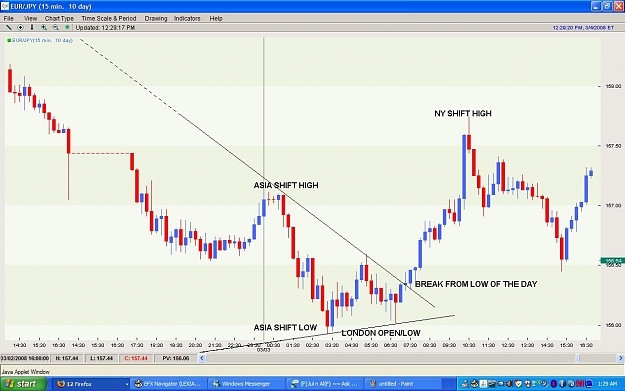
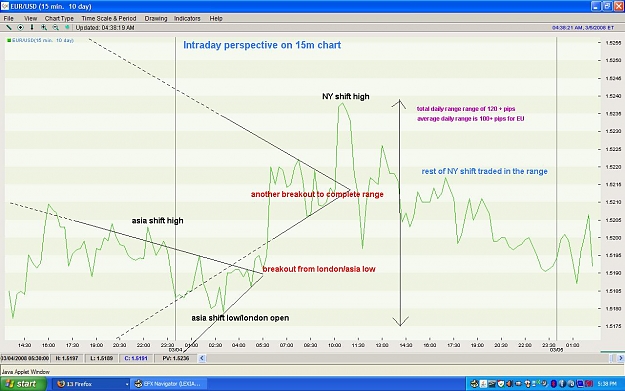
-during asian session it managed a high and low of about 100 pips.
-the ave daily range of EJ is 150 pips.
-so the breakout from the low of london session may at least retrace to asia high.
-and breaking above asia high would mean completing its ave daily range of about 150 pips. Which in this case it did. Notice it fell back throughout the NY session after completing its daily range.
How do I know the London low is really the low ?
Simply because during the London session it never break the asia low.
How do i know the NY high is really the high of the day ?
Counting from the lowest point of the day, it has moved about 180 pips, so probability of it going higher is slim.
aediaz1, I dont trade during the asia session lot, however the price action during that time gives important clues and turning points. There are instances not often where the particular pair finishes it average daily range within the asian session, then such cases where breakouts on either extremes are not useful anymore. A retracement is more likely.
Your fav pair is GJ ? LOL i have bad experiences with this pair, not all bad though. Even if I trade this pair, I would usually go in only after NY start, so I can see where it has been during the past 2 sessions.
For me I will only trade GJ on extreme movements, eg GJ breaking out of a pattern at the same time violating ASIA levels in the NY session.
I think GJ moves around 200-300 pips a day ?
Its about getting a good feel of it, healthy intuition is required I guess.
You might find the high and lows of the different sessions useful. Should give some clues to how far it can go. Its up to your imagination.
Regards
mARK
Ignored
Thank you for sharing this with us. It really gave me appetite to dig into this again. As mentioned, I haven't paid much attention about Asia session, TBH.
I also see the value of knowing if a pair is "exhausted" when it comes to a crucial breakout point. This little method could help
About gbp/jpy, I also started out on this pair and lost alot too haha. But I never gave up on it, because I saw the great potential in it.
The average daily range is just another concept in technical analysis, it has been discussed in some threads here as well. It is probably under utilized . I find it complimentary to line drawing. Not wanting to go off topic, see how this recent triangle breakout can be taken with more confidence if you consider the following simple facts :
- USD/CHF typically averages more than 100 pips a day ( 24 hr period )
- above we have a triangle that breaks out of a 30 plus pip range during asian session, thus we can safely project a potential move in the direction of the break of at least 30 to 80 pips depending on how you manage your trade.
Mainly its about trying to feel the market, something like trying to predetermine whether if the break is worth taking, and if taken to what extend can you expect it to move ? Unfortunately there is no precise points to follow in this, only estimation. Practice is essential. Like aediaz1 uses fibs and pivots in conjunction with trendlines, I use this.
And of coz there are weekly , monthly , yearly ranges to consider too.
Simple ?
mARK
Ignored
Hello Mark, what a great info u had here. u really did enlighten us, at least for me, with ur avg daily range and linking it with breakouts. for breakout trading i only learn how to spot breakout and confirm the validity of breakout. but now i learnt from u another aspect of breakout trading, which is an estimation of determining the strength/potential of a breakout and it can be applied to whether the breakout is worth taking Thank you for ur contribution.
|
Joined Nov 2007
|
Status: Self Mastery
|178 Posts
Wild Horse(GJ) is ranging now. She is now resting to gather more power to resume it's downtrend if 203.50 fails to hold. However, on the upside if 205.50 does not hold, we are looking for a retracement to 207 area. JMHO
Wild Horse(GJ) is ranging now. She is now resting to gather more power to resume it's downtrend if 203.50 fails to hold. However, on the upside if 205.50 does not hold, we are looking for a retracement to 207 area. JMHO
Don't pay too much attention on smaller tf's, but if price breakout from this 15m pennants, we should see a drop down to 203.60 area and a break to the upside could generate more buyings, IMO.
Update: Broken, lets see if 15m can generate some pips
Your right about 203.50 and 205.50. I'm looking for a retrace to 208.47 area (50% fib on 4h), second target 213 (if 203.50 area holds of course).
Ignored
Thanks aediaz1
btw, u mean if 203.50 holds, u'll be going long?? wont't u wait for a break above 205.50 first and see whether it holds?
Anyway i need ur help here, this is an hrly chart of USD/CHF does my upper trendline look valid? (the bold one in pink) i ask because the points tt connects the line does not look strong. however i drew it because it was obvious.
Don't pay too much attention on smaller tf's, but if price breakout from this 15m pennants, we should see a drop down to 203.60 area and a break to the upside could generate more buyings, IMO.
Update: Broken, lets see if 15m can generate some pips
Ignored
Sharp eyes! morever GU is bearish now and UJ is bullish.
btw, u mean if 203.50 holds, u'll be going long?? wont't u wait for a break above 205.50 first and see whether it holds?
Anyway i need ur help here, this is an hrly chart of USD/CHF does my upper trendline look valid? (the bold one in pink) i ask because the points tt connects the line does not look strong. however i drew it because it was obvious.
203.50 area is previous low, I'm pretty sure we could see some sort of a bounce from here. But if price is rushing past it without any reaction I will of course don't take a long.
Usd/chf; Your lines does look valid (purple). I thing to check if it was valid if to see if the price gave any reaction to a break. Did it? Yes. It took of by 35 pips. Price have broken for the upside on 1h, and next target could be resistance-line on 4h which is .0455. Notice that upper trendline on 1h chart isn't drawn from any clear candlestick-points, only based on logical drawing.
Hello Mark, what a great info u had here. u really did enlighten us, at least for me, with ur avg daily range and linking it with breakouts. for breakout trading i only learn how to spot breakout and confirm the validity of breakout. but now i learnt from u another aspect of breakout trading, which is an estimation of determining the strength/potential of a breakout and it can be applied to whether the breakout is worth taking Thank you for ur contribution.
Oops, we have 2 Mark here now..
Gd trading to all
Yuna
Ignored
Hello Yuna,
Glad to be able to contribute here, notice you Singaporean too ?
Just saw your post, I guess you trade from office ? Considering the timing...
Regarding average daily range, remember there is no fixed points, only estimations, if you hold trades anywhere more than 72 hours, taking note of ave weekly range is useful as well.
203.50 area is previous low, I'm pretty sure we could see some sort of a bounce from here. But if price is rushing past it without any reaction I will of course don't take a long.
Usd/chf; Your lines does look valid (purple). I thing to check if it was valid if to see if the price gave any reaction to a break. Did it? Yes. It took of by 35 pips. Price have broken for the upside on 1h, and next target could be resistance-line on 4h which is .0455. Notice that upper trendline on 1h chart isn't drawn from any clear candlestick-points, only based on logical drawing.
Ignored
Thanks, i'll take note of ur point. yea, no clear candlestick points, tt's y i check with u whether my line was valid. any way what happened to the pound? was it because of the news? PMI news. take a look at GU and GJ.
Thanks, i'll take note of ur point. yea, no clear candlestick points, tt's y i check with u whether my line was valid. any way what happened to the pound? was it because of the news? PMI news. take a look at GU and GJ.
Glad to be able to contribute here, notice you Singaporean too ?
Just saw your post, I guess you trade from office ? Considering the timing...
Yes, i'm Singaporean. i checked ur profile liao, u also Singaporean sia. Rare to see Singaporeans here lehz. No, I'm on demo. still learning..
Regarding average daily range, remember there is no fixed points, only estimations, if you hold trades anywhere more than 72 hours, taking note of ave weekly range is useful as well.