People have different drawing-ways, for me, I like to include shadows too, mostly because it includes more of the swings in the market. If you are unsure, try and see if lines drawn from shadows/no shadow can fit with round numbers too. Practice pays off
Ignored
Thanks I totally agree with you practice is crucial, in my case both works for me, usually i follow one general guideline that is it has to be obvious and logical, if I find myself trying to ''justify'' those lines drawn then I will not take it.
Thanks I totally agree with you practice is crucial, in my case both works for me, usually i follow one general guideline that is it has to be obvious and logical, if I find myself trying to ''justify'' those lines drawn then I will not take it.
Cheers
mARK
Ignored
Well said. It's really that easy. For me, I try apply those "rules" as stated in the beginning of this thread, but I don't hesitate drawing lines if they seems quite obvious. When you have those lines, you will/have been amazed how accurate they can be.
Well said. It's really that easy. For me, I try apply those "rules" as stated in the beginning of this thread, but I don't hesitate drawing lines if they seems quite obvious. When you have those lines, you will/have been amazed how accurate they can be.
Ignored
Hi aediaz,
Can you help me on the right time of entering a trade.It always go the other way when i enter a trade.I was told that once the candle breakout from the treandline wait for the candle to close.It has to be outside of the line and you will only enter trade on next candle 5 pips away from previous close candle.is this true or is there a better way to enter? And which is the best TF to apply for the treandline method.Thanks bro.
Ignored
Hi karimr. Nr 1 rule that could help you in the start would be following the main (or intra-day) trend. Eur/usd provides a good example.
Take a look at the picture. I have painted all the candles you would have most likely lost your trades on (blue) if you entered short based on 4h. Now, eurusd could give us many good trades if only we followed this upward trend, agree ?
I know this have nothing to do about trendlines, but it really clarify the whole idea trading with the trend. It's almost hard to make bad trades when you follow such a strong trend.
At the start of your trading-career, I find this as a good strategy for decreasing your losses. As you gain more experience and confidence, you could move on to trading against the trend.
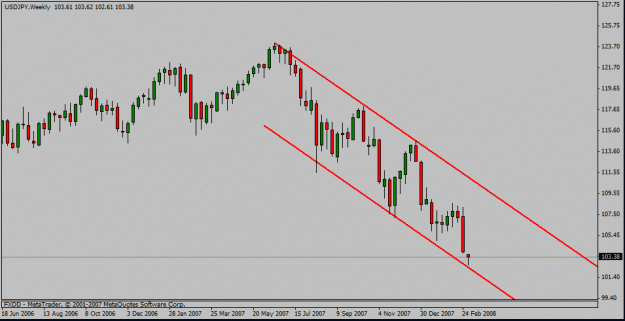
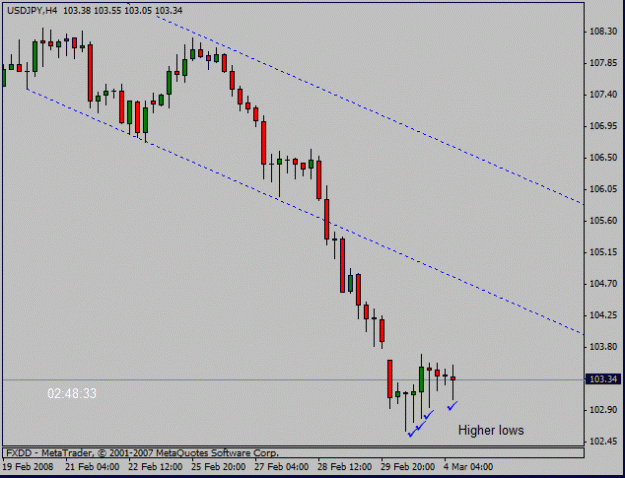
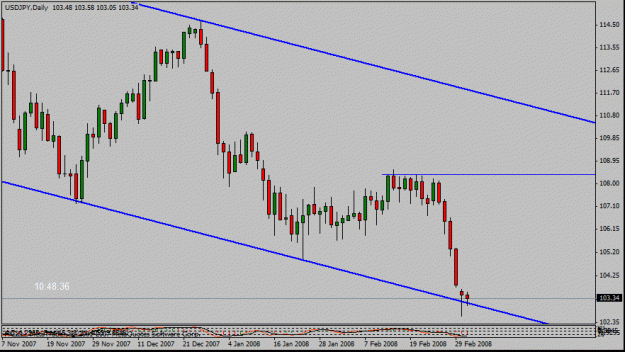
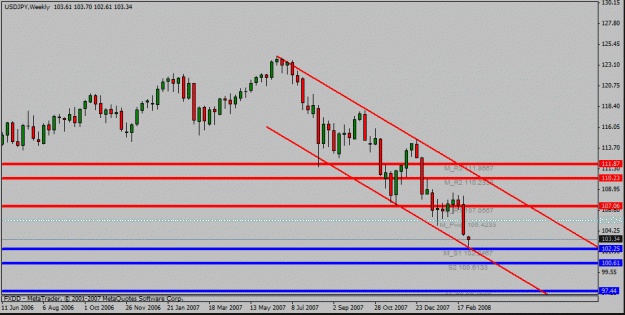
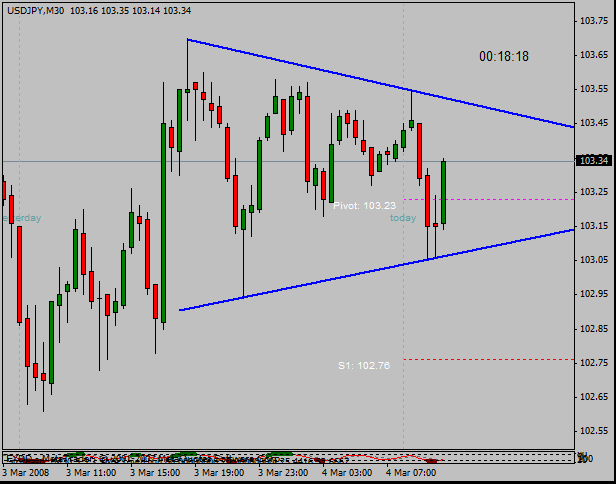
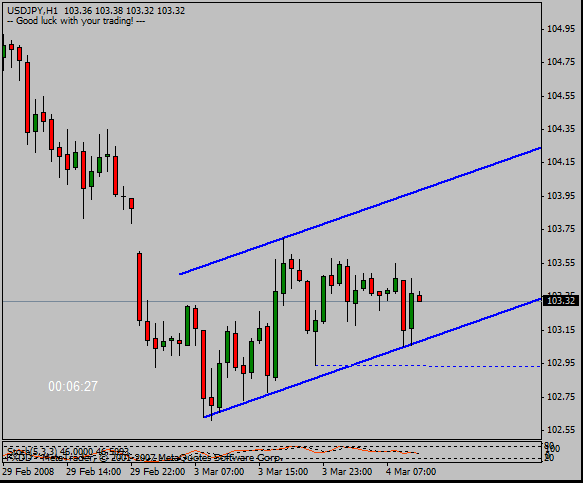
Ok, trading of trend-lines. First, take one pair for a start. Apply 30m,1h,4h,daily and weekly. If you like, add monthly pivots to weekly chart and daily pivots to 30m (I only look at how the price reacts to pivot point on 30m).Weekly, try look how price reacts to all its levels.
Try to apply trendlines on all the currently timeframes you got. I have given you usdjpy as an example here. What does this charts tell you? Looks like it's starting to retrace on the lower timeframes and if you see on daily and monthly charts, you see that price is finding it hard to penetrate those support-lines.
How can you trade it then ? You have rule nr 1, trading with the (intra-day/long-term) trend. As you see on 30m, 1h and 4h we are making higher lows, so if you are a short-term trader you would be looking to entry when price falling down and testing support-lines on 30m and 1h. If you trade long-term, you would be looking for short positions (daily and weekly) and you would find entry's at resistance-line on daily/weekly.
About breakouts, I'll show you a picture on next post.
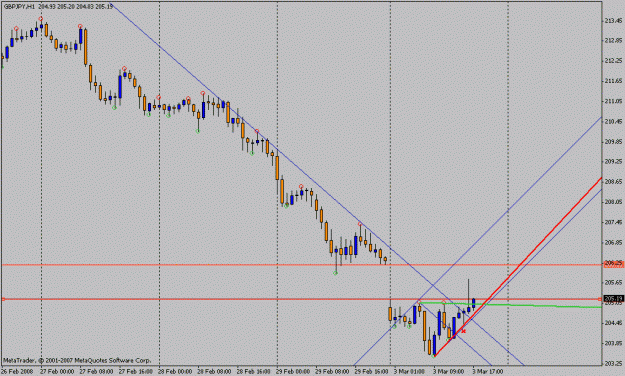
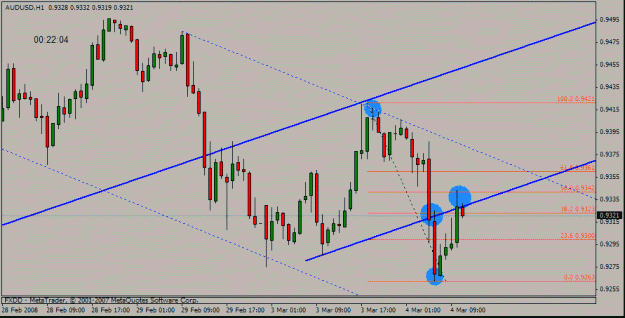
Breakouts. Gonna show you aususd, 1h and 4h chart. Apply fibonacci from last bull/bear run. If you see on 1h chart, price have broken that line and retested it. Also see that fib is correlating with (now) resistance-line.
When trading breakouts, I only take a trade when price is coming back to test it, and hold.
Move up to 4h chart to confirm that this could be a good trade. Always correlate with other timeframes ! If you see on weekly, notice alot of selling at currently level according to candlestick (long shadows).
This charts have (hopefully) educational purpose, don't take it as trade calls.
I am not sure if this is relevant, however I place a lot of emphasis on average trading ranges, daily or weekly. Breakouts of patterns like trendlines, wedges or triangles are more meaningful at certain levels.
eg, on an intraday timeframe and assuming you start at NY session
We have to see what range the particular pair had achieved during the tokyo session as well as the london session. Assuming pair X averages 100 pips a day and it has already met this range during the first half of the london session, then a breakout of a channel on the upside for example would not yield very good odds if this breakout occurs at the upper extreme of the previously establish range. If the scenario is such that pair X only managed 50 pips prior to NY start, then the same breakout would be meaningful.
Listing all possible scenarios would be too long to type, hope you get the idea. Of course always trade in the direction of the intermediate or main trend.
mARK
Ignored
I understand what you say, I have tried myself to apply some sort of strategy when it comes to trading range, but haven't been able to make any good conclusion so far. So if you can provide us with some examples where you take benefits from trading range I would be more than happy
I'll try myself on gbpyjpy. According to the last 6 days of movement (total pips / 6 days), possible targets would be 202.70 and 207.22.
really simple and interesting thread. I will try to participate here as well.
Maybe someone would like to share Cable and EU chart?
Ignored
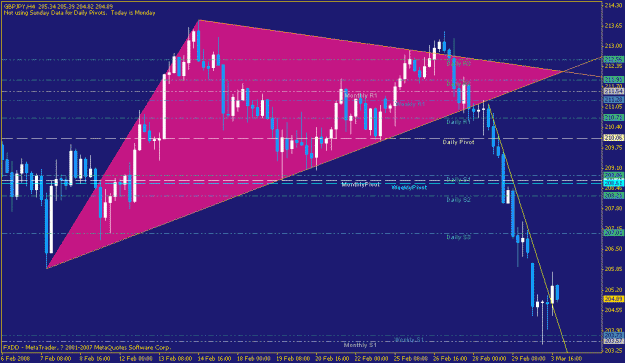
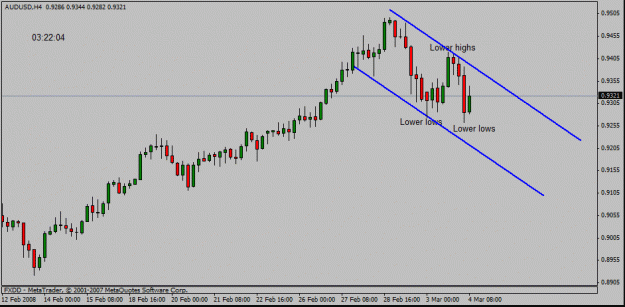
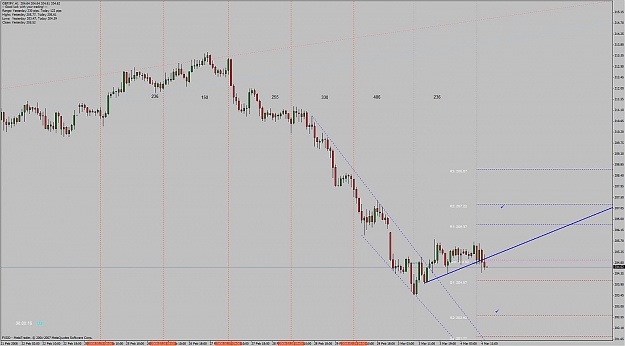
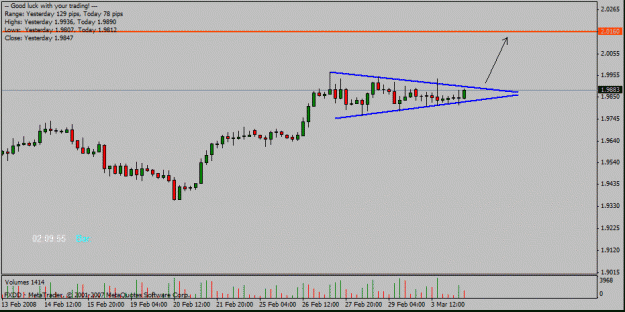
Pennat formation (known as continuation pattern and formed by a consolidation period, which gives converging trendlines) on 4h. A break from this would be interesting for the upside, IMO. If broken, I'm targeting .9962 (resistance on daily).
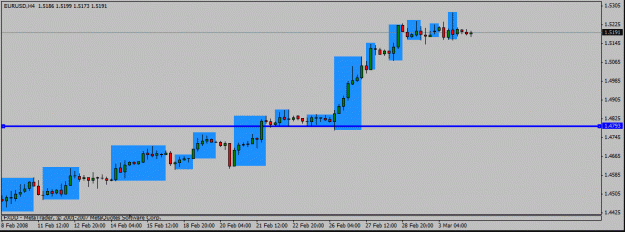
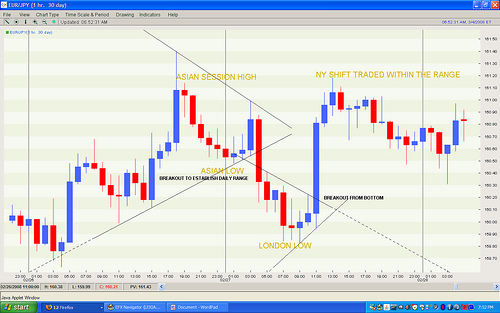
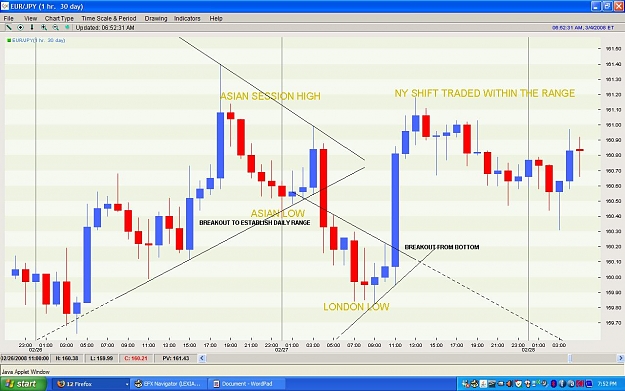
So you can see on EUR/JPY hourly chart, it only managed about 90 pips during the asia session, so when it broke out of the triangle on the downside, we can easily conclude that this break is favorable as it may seek to establish its average trading range of about 150 pips. During the london session the price went on down to around 159.80. So from asia high to london low is about 160 pips, chances of it going lower is slim.
Thus on the second triangle breakout, its on the upside on the lower extreme of the day's range, so its a good trade.
And throughout the NY session its traded within the range.
Every pair is capable to moving a certain range per day, of course there are exceptions but its not as frequent as its average daily.
mARK
hope this works out as I not too sure about the image attahment clarity.
Ignored
What you say here sounds interesting. Unfortunately, I still can't see your charts. Did you find that attachment icon ?