• Home
  • Forums
  • Trades
  • News
  • Calendar
  • Market
  • Brokers
  • Login
  • Join
  • User/Email: Password:
  • 2:50am
Menu
  • Forums
  • Trades
  • News
  • Calendar
  • Market
  • Brokers
  • Login
  • Join
  • 2:50am
Sister Sites
  • Metals Mine
  • Energy EXCH
  • Crypto Craft

Options

Bookmark Thread

First Page First Unread Last Page Last Post

Print Thread

Similar Threads

Indicator for Auto-drawing trendlines 30 replies

drawing trendlines 6 replies

Preffered timeframe for drawing trendlines 7 replies

Too many drawn Trendlines all same look: how to draw Trendlines with different look? 2 replies

books for drawing trendlines??? 6 replies

  • Trading Discussion
  • /
  • Reply to Thread
  • Subscribe
  • 25
Attachments: Drawing Correct Trendlines
Exit Attachments

Drawing Correct Trendlines

  • Last Post
  •  
  • Page 1 2 3
  • Page 1 2 3
  •  
  • Trend Trading | Brokerage Account XXXX22
  • Expand
  • Retract
  • Last Sync: Sep 13, 2016
  • Overview

  • Trade Report

  • Trade Graph

  • Trade List

Sep 13, 2016
Last Sync: Sep 13, 2016
  • Overview

  • Trade Report

  • Trade Graph

  • Trade List

  • Period: All History

Sep 13, 2016
Last Sync: Sep 13, 2016
  • Overview

  • Trade Report

  • Trade Graph

  • Trade List

Sep 13, 2016
Last Sync: Sep 13, 2016
  • Overview

  • Trade Report

  • Trade Graph

  • Trade List

Sep 13, 2016
Last Sync: Sep 13, 2016
  • All History
  • Today
  • Yesterday
  • This Week
  • This Month
  • This Year
  • Last Week
  • Last Month
  • Last Year
to
No trading activity in this period.
  • Opened Nov 21, 2010 | Never Closes | 82 Votes
  • Poll Results
I already had a efficient way of applying trendlines  
Yes 43 Votes
52%
No 13 Votes
16%
Neither, I don't rely on trendlines 5 Votes
6%
Looking for a new approach 19 Votes
23%
Others, please specify 2 Votes
2%
  • Post #1
  • Quote
  • First Post: Edited Nov 11, 2011 1:19pm Nov 21, 2010 7:38pm | Edited Nov 11, 2011 1:19pm
  •  aediaz1
  • Joined Aug 2007 | Status: Member | 3,134 Posts
A lot of people have asked me how to draw a trendline during the past years, also sharing their concern about lack of proper knowledge about such an well-known phenomenon like trendlines. So I decided to share a set of rules in this how-to thread with main focus on correct identification.

Criteria & identification
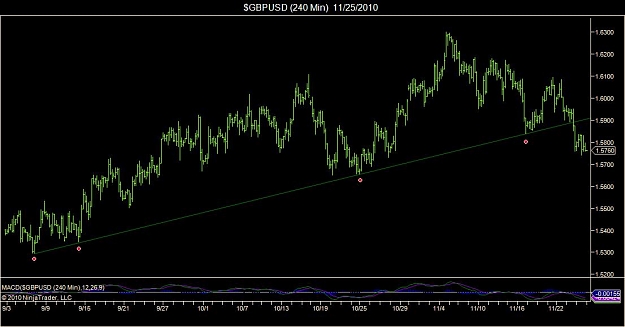
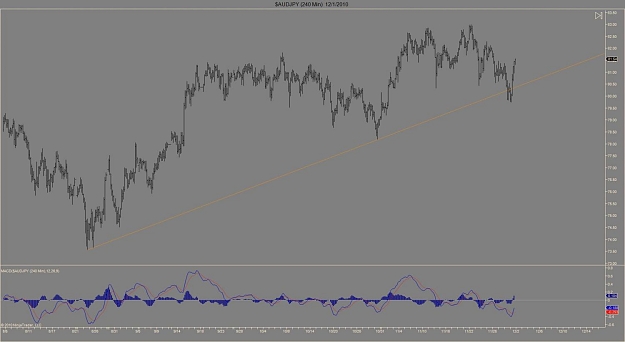
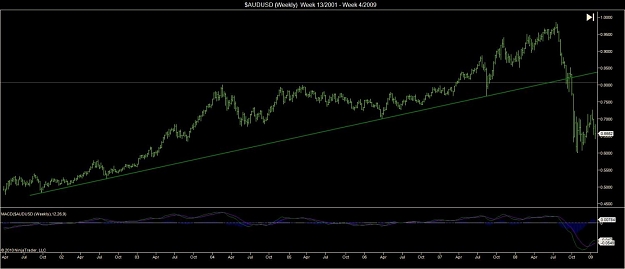
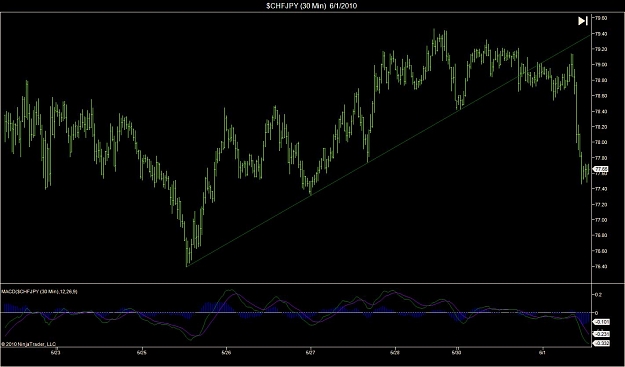
Any trendline should be drawn through/connecting at least 3 extreme points on your chart without any intersection to the other side, not even by 1 pip. This goes for all time-frames but expect a larger follow-through on higher time-frame. Note that a break of a trendline lasted for several years usually results in a trend reversal (see aud/usd chart).

Plan of action
There are two ways to take advantage out of a trendline:

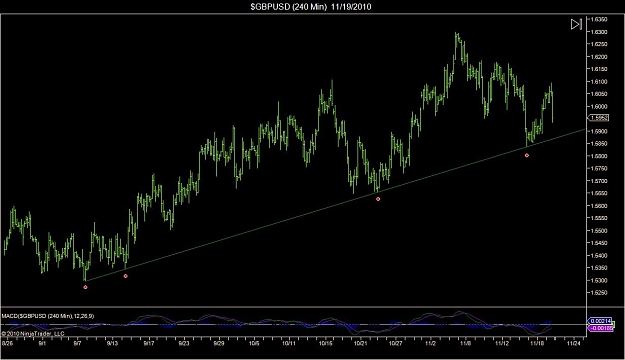
1. Either by buying/selling 5 pips ahead of the trendline acting as support/resistance. Only valid when price is heading for the forth touch towards the trendline.
2. Anticipating a break-out. The trendline has now four touches and price is heading for a fifth touch, which in most cases leads to a break-out. A break-out occurs when price has broken the trendline even by one pip.

Stop loss should always be placed outside the daily range. If price is further away than 40 pips, I skip the whole scenario because of the wide stop loss.

Note of caution
A perfect trendline setup is rather rare so don't expect it to happen once a day. You will also find that it takes some practice to get this right since conducting a trading-plan relaying only on a single angled line is rather complicated.
This is no holy grail and you should expect false break-outs to occur from time to time. This should not be problematic for a trader if proper money-management is used.
Attached Images (click to enlarge)
Click to Enlarge

Name: aud long term.jpg
Size: 72 KB Click to Enlarge

Name: Correct TL.jpg
Size: 85 KB Click to Enlarge

Name: Trendline.jpg
Size: 98 KB
Measure twice, cut once
  • Post #2
  • Quote
  • Nov 21, 2010 8:16pm Nov 21, 2010 8:16pm
  •  candlepips
  • | Joined Oct 2010 | Status: Sentiment Freak | 33 Posts
Don't you think 3 points make it very conservative? I look at 2 points as a valid trendline and 3rd point as an opportunity to buy/sell. If 3rd point breaks, I don't consider it valid at all.

Please continue to share your knowledge.
 
 
  • Post #3
  • Quote
  • Nov 22, 2010 5:56pm Nov 22, 2010 5:56pm
  •  aediaz1
  • Joined Aug 2007 | Status: Member | 3,134 Posts
Quoting candlepips
Disliked
Don't you think 3 points make it very conservative? I look at 2 points as a valid trendline and 3rd point as an opportunity to buy/sell. If 3rd point breaks, I don't consider it valid at all.

Please continue to share your knowledge.
Ignored
I'm glad forex trading isn't that easy, just plotting a line between 2 points and buy/sell on the third approach :=)

I will provide more examples as they unfolds.
Measure twice, cut once
 
 
  • Post #4
  • Quote
  • Nov 22, 2010 9:05pm Nov 22, 2010 9:05pm
  •  candlepips
  • | Joined Oct 2010 | Status: Sentiment Freak | 33 Posts
I trade using price action/candlesticks/S&R. When I said the above, I didnt mean I buy/sell merely at 3rd touch.

However, since this is your thread, I will let you develop it. Good luck.

Quoting aediaz1
Disliked
I'm glad forex trading isn't that easy, just plotting a line between 2 points and buy/sell on the third approach :=)

I will provide more examples as they unfolds.
Ignored
 
 
  • Post #5
  • Quote
  • Edited at 9:59pm Nov 22, 2010 9:47pm | Edited at 9:59pm
  •  King Singh
  • | Joined Feb 2010 | Status: Member | 78 Posts
Quoting candlepips
Disliked
Don't you think 3 points make it very conservative? I look at 2 points as a valid trendline and 3rd point as an opportunity to buy/sell. If 3rd point breaks, I don't consider it valid at all.

Please continue to share your knowledge.
Ignored
Heah Adiaz..
I second that.. Two touches are enough for a good trendline and entry point at the third (to the pip) which must also include some additional points of confluence i.e. round numbers, fibs, support turned resistance or vice versa, etc.
A cross and test of two trendlines at the third point works pretty nicely.


Nways thanks for starting the thread.. (I appreciate your trading skills with diamonds..)

p.s. I also like Ehrek's approach. He is a very good trendline trader.
 
 
  • Post #6
  • Quote
  • Nov 24, 2010 2:47pm Nov 24, 2010 2:47pm
  •  niteshift02
  • | Joined May 2010 | Status: Looking for the KO trade | 471 Posts
Hey aediaz,

Glad you started this thread, can't wait to see what gems you have to offer. I remember the days when I thought 2 touches make a trendline, those days seem so far away now

And for those that don't know, here's something to think about:

"...you can join any 2 points in space and create a trendline. So is your trendline technically significant?..."

Peace
 
 
  • Post #7
  • Quote
  • Nov 24, 2010 2:52pm Nov 24, 2010 2:52pm
  •  aediaz1
  • Joined Aug 2007 | Status: Member | 3,134 Posts
Quoting King Singh
Disliked
Heah Adiaz..
I second that.. Two touches are enough for a good trendline and entry point at the third (to the pip) which must also include some additional points of confluence i.e. round numbers, fibs, support turned resistance or vice versa, etc.
A cross and test of two trendlines at the third point works pretty nicely.


Nways thanks for starting the thread.. (I appreciate your trading skills with diamonds..)

p.s. I also like Ehrek's approach. He is a very good trendline trader.
Ignored
Welcome.

Quoting niteshift02
Disliked
Hey aediaz,

Glad you started this thread, can't wait to see what gems you have to offer. I remember the days when I thought 2 touches make a trendline, those days seem so far away now

And for those that don't know, here's something to think about:

"...you can join any 2 points in space and create a trendline. So is your trendline technically significant?..."

Peace
Ignored
Some gems will be shown but the frequency (distribution) of those are luckily so far distanced from each-other that this concept will never attract the mainstream
Measure twice, cut once
 
 
  • Post #8
  • Quote
  • Nov 24, 2010 3:02pm Nov 24, 2010 3:02pm
  •  aediaz1
  • Joined Aug 2007 | Status: Member | 3,134 Posts
Here is the BO on gbp/usd;
Attached Image (click to enlarge)
Click to Enlarge

Name: $GBPUSD (240 Min) 11_25_2010.jpg
Size: 68 KB
Measure twice, cut once
 
 
  • Post #9
  • Quote
  • Nov 27, 2010 2:55am Nov 27, 2010 2:55am
  •  belekas
  • Joined Sep 2007 | Status: gone fishing | 5,782 Posts
Channel BO on the CAD/JPY:
Attached Image (click to enlarge)
Click to Enlarge

Name: cadjpy_bo_11272010.jpg
Size: 91 KB
 
 
  • Post #10
  • Quote
  • Nov 27, 2010 3:30am Nov 27, 2010 3:30am
  •  candlepips
  • | Joined Oct 2010 | Status: Sentiment Freak | 33 Posts
I better make it clear here. When I draw trendlines, I look for two price points to connect (to the pip). Then I wait for a third touch, if price bounces, it becomes a valid trendline for me, and I look for a trade opp. If it breaks, it is not a trendline for me. I usually expect a breakout on the 4th touch.

I don't care what this guy is teaching, coz I follow my rules; and I was only asking him a question, to know his perspective. He decided to be sarcastic about it in stead.

Anyways, please continue to benefit everyone here.

Good Luck!

Quoting niteshift02
Disliked
Hey aediaz,

Glad you started this thread, can't wait to see what gems you have to offer. I remember the days when I thought 2 touches make a trendline, those days seem so far away now

And for those that don't know, here's something to think about:

"...you can join any 2 points in space and create a trendline. So is your trendline technically significant?..."

Peace
Ignored
 
 
  • Post #11
  • Quote
  • Nov 27, 2010 4:32am Nov 27, 2010 4:32am
  •  aediaz1
  • Joined Aug 2007 | Status: Member | 3,134 Posts
Quoting candlepips
Disliked
I better make it clear here. When I draw trendlines, I look for two price points to connect (to the pip). Then I wait for a third touch, if price bounces, it becomes a valid trendline for me, and I look for a trade opp. If it breaks, it is not a trendline for me. I usually expect a breakout on the 4th touch.

I don't care what this guy is teaching, coz I follow my rules; and I was only asking him a question, to know his perspective. He decided to be sarcastic about it in stead.

Anyways, please continue to benefit everyone here.

Good Luck!...
Ignored
I would not go that far saying I'm teaching anything in this thread, I'm barely sharing some point of experience. I was teaching, none of the participants in this thread would have anything to say

Second, I'm starting to get very conservative when it comes to TA, I don't worry much what others do but there is nothing wrong with sharing ideas.
Measure twice, cut once
 
 
  • Post #12
  • Quote
  • Nov 27, 2010 11:21pm Nov 27, 2010 11:21pm
  •  candlepips
  • | Joined Oct 2010 | Status: Sentiment Freak | 33 Posts
Sounds good. Please continue sharing your knowledge.

Quoting aediaz1
Disliked
I would not go that far saying I'm teaching anything in this thread, I'm barely sharing some point of experience. I was teaching, none of the participants in this thread would have anything to say

Second, I'm starting to get very conservative when it comes to TA, I don't worry much what others do but there is nothing wrong with sharing ideas.
Ignored
 
 
  • Post #13
  • Quote
  • Dec 1, 2010 2:17pm Dec 1, 2010 2:17pm
  •  alter
  • | Joined Jul 2008 | Status: Member | 429 Posts
Hello
would this be valid TL according your rules? 3 hits so far.
Attached Image (click to enlarge)
Click to Enlarge

Name: gbpchfh1.gif
Size: 21 KB
 
 
  • Post #14
  • Quote
  • Dec 1, 2010 3:26pm Dec 1, 2010 3:26pm
  •  aediaz1
  • Joined Aug 2007 | Status: Member | 3,134 Posts
Quoting alter
Disliked
Hello
would this be valid TL according your rules? 3 hits so far.
Ignored
The two last touches are too clustered compared to the first point. If the starting-point was located a few bars away from the two last you might have something.

Here is your scenario reversed on aud/jpy.
Attached Image (click to enlarge)
Click to Enlarge

Name: $AUDJPY (240 Min) 12_1_2010.jpg
Size: 71 KB
Measure twice, cut once
 
 
  • Post #15
  • Quote
  • Dec 1, 2010 4:09pm Dec 1, 2010 4:09pm
  •  alter
  • | Joined Jul 2008 | Status: Member | 429 Posts
This is what I was wondering.
Thank u for clarification Ill post some more examples when time is right.
 
 
  • Post #16
  • Quote
  • Dec 1, 2010 5:07pm Dec 1, 2010 5:07pm
  •  GEfx
  • Joined May 2009 | Status: Member | 3,459 Posts
Thanks for starting this thread. I looked at your gbp/$ 240 chart above and went back to my charts to see how I built up to your trend line (I believe I got it right using the orange line on the following chart). By built up, I mean how did my trend lines, capturing what was the "current" trend action as the chart was developing. Kind of interesting how the orange line developed over time. Do you trend the more current action or try to stay with longer time lines?

I don't use trend lines to tell me when to enter, rather to tell me when not to enter, but I do spend a lot of time drawing these things all day long (on lower compression charts). Again, thanks for taking the time to start this and share your ideas. Good trading to you.

Attached Image (click to enlarge)
Click to Enlarge

Name: trendlines.gif
Size: 18 KB
 
 
  • Post #17
  • Quote
  • Dec 1, 2010 5:18pm Dec 1, 2010 5:18pm
  •  TheMonk
  • | Additional Username | Joined Jul 2008 | 114 Posts
hi aediaz1

I have seen your thread at Igrok

I believe you are really helping and throwing out pearls

Please contine - I am listening (reading) and very interested

Please do you have more examples ?

When you draw 3 touch trendlines do you look at S&R ?

Monk
 
 
  • Post #18
  • Quote
  • Dec 2, 2010 9:59am Dec 2, 2010 9:59am
  •  aediaz1
  • Joined Aug 2007 | Status: Member | 3,134 Posts
Quoting GEfx
Disliked
Thanks for starting this thread. I looked at your gbp/$ 240 chart above and went back to my charts to see how I built up to your trend line (I believe I got it right using the orange line on the following chart). By built up, I mean how did my trend lines, capturing what was the "current" trend action as the chart was developing. Kind of interesting how the orange line developed over time. Do you trend the more current action or try to stay with longer time lines?

I don't use trend lines to tell me when to enter, rather to tell me when not...
Ignored
I do not like too angled TL. Exceptions are made if it happens on larger TF and does make sense on lower TF.

To define if a trend is up/down, I use simple and mechanical tool but since this is a thread about TL I will not elaborate further on it

Quoting TheMonk
Disliked
hi aediaz1

I have seen your thread at Igrok

I believe you are really helping and throwing out pearls

Please contine - I am listening (reading) and very interested

Please do you have more examples ?

When you draw 3 touch trendlines do you look at S&R ?

Monk
Ignored
Good to hear.

I look at many different things when building a trading-plan. Many of those concepts can be found in Igroks thread.
Measure twice, cut once
 
 
  • Post #19
  • Quote
  • Dec 2, 2010 10:31am Dec 2, 2010 10:31am
  •  aiyahmarklah
  • Joined Jan 2008 | Status: Member | 1,037 Posts
SUBSCRIBED
 
 
  • Post #20
  • Quote
  • Dec 3, 2010 6:58am Dec 3, 2010 6:58am
  •  aediaz1
  • Joined Aug 2007 | Status: Member | 3,134 Posts
Quoting aiyahmarklah
Disliked
SUBSCRIBED
Ignored
Good to see you again Mark

Here is a scenario on gbp/cad. Unfortunately, todays high was too far so no place to hide my SL. So no trade.
Attached Image (click to enlarge)
Click to Enlarge

Name: gbpcad.gif
Size: 24 KB
Measure twice, cut once
 
 
  • Trading Discussion
  • /
  • Drawing Correct Trendlines
  • Reply to Thread
    • Page 1 2 3
    • Page 1 2 3
0 traders viewing now
  • More
Top of Page
Forex Factory Blog Updated: Alerting All Members
  • Facebook
  • Twitter
About FF
  • Mission
  • Products
  • User Guide
  • Media Kit
  • Blog
  • Contact
FF Products
  • Forums
  • Trades
  • Calendar
  • News
  • Market
  • Brokers
  • Trade Explorer
FF Website
  • Homepage
  • Search
  • Members
  • Report a Bug
Follow FF
  • Facebook
  • Twitter

FF Sister Sites:

  • Metals Mine
  • Energy EXCH
  • Crypto Craft

Forex Factory® is a brand of Fair Economy, Inc.

Terms of Service / ©2022