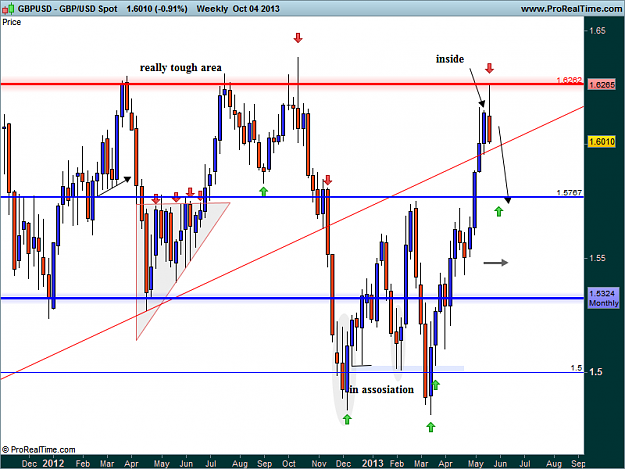
we have seen a up trend for cover long upper wick (past week-weekly candle chart GBPUSD) BUT if look at daily candle chart GBPUSD . you can see easily a trap bull
Joined Nov 2007
|
Status: left CanaryWharf desk-tea break
|23,459 Posts
Hi kelic I don't think you see morning star as if you read the description it dose not fit ,
even my example's are not perfect ,but im thinking we wont see as good a result from this set up
Joined Nov 2007
|
Status: left CanaryWharf desk-tea break
|23,459 Posts
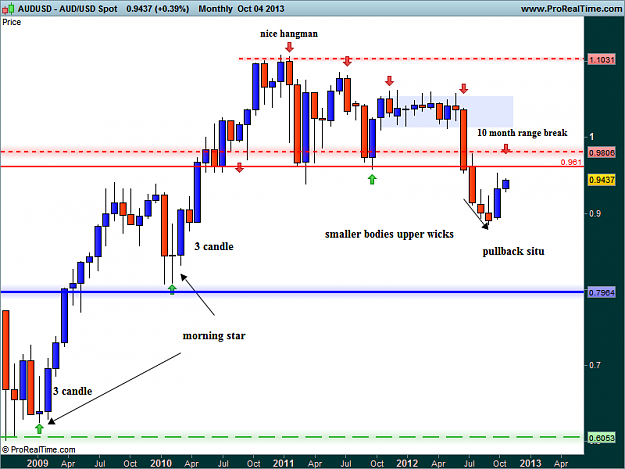
actually doesn't surprise me the time required for this to produce desired result as monthly ,but as hang men go its very nice in my eyes ,hangman can be pullback scenario ,as wicks are the thing we can read aggression from
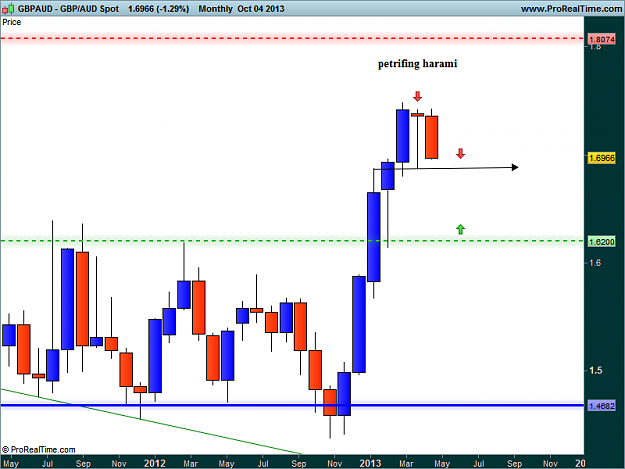
uj ,im sure will work bear ,but this is monthly must not rush as Hussin would say ,I think I see the build up elections could be key this weekend ,just noticed {image}
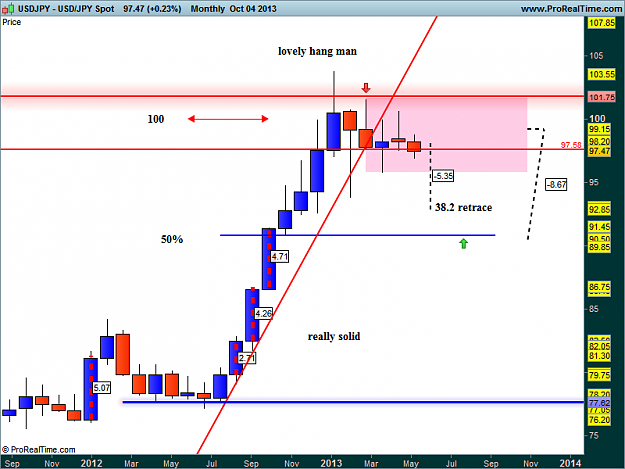
{quote} it is not wonderful for you , that we have a bearish engulfing in the beginning this week till yesterday (please see daily candle chart USDYEN) but now in the end of week , we can not see a bearish engulfing pattern. why ? now if you see weekly candle chart USDYEN , you can easily see a petrifying harami pattern . in fast bearish petrifying harami pattern is very similar a bearish engulfing pattern . for appearance this pattern (petrifying harami) we must forecast that the price moves can not move in lower previous candle (weekly or blue...