If you were to trade this, how would you do it?
And what do you see as a target?
Thanks,
Rob
Ignored
hi Rob
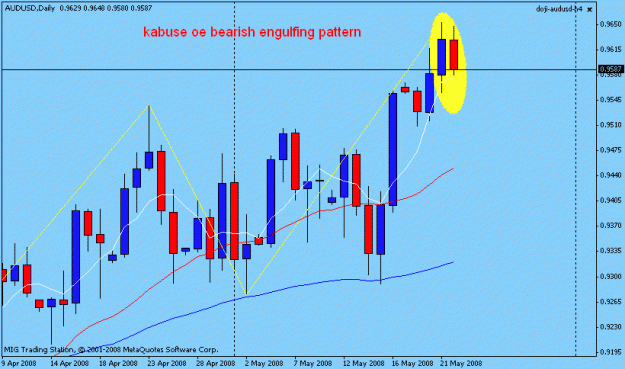
i have closed on sell AUDZND with high profit.but now im monitoring EURUSD-AUDUSD-AUDYEN-USDCHF.
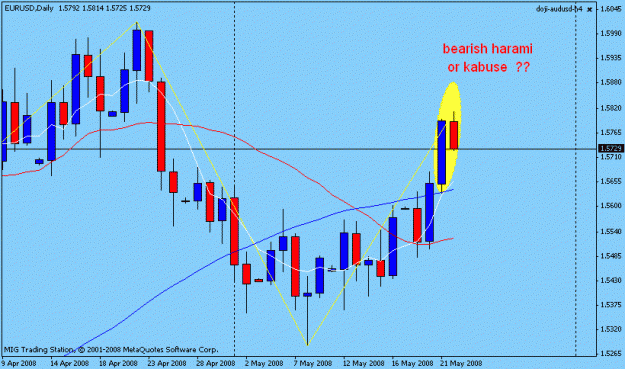
for trade on EURUSD im waiting forming a healthy bearish harami or a daily close also 1 tp below 1.5560
hi Rob
i have closed on sell AUDZND with high profit.but now im monitoring EURUSD-AUDUSD-AUDYEN-USDCHF.
for trade on EURUSD im waiting forming a healthy bearish harami or a daily close also 1 tp below 1.5560
Ignored
so you now waiting for EU short?and you think GU gonna make a fall tomorrow?
Source: Thomson Reuters
(END) Dow Jones Newswires
May 22, 2008 10:10 ET (14:10 GMT)
if we see a close above 3.96(us.10.treasury) this week .usdyen will go up 106
hi Rob
i have closed on sell AUDZND with high profit.but now im monitoring EURUSD-AUDUSD-AUDYEN-USDCHF.
for trade on EURUSD im waiting forming a healthy bearish harami or a daily close also 1 tp below 1.5560
Ignored
Hussin,
Congratulations on AUDNZD !!!
Thanks for sharing your thoughts about EURUSD.
I had a very good run up
|
Joined Feb 2008
|
Status: Senior Member
|560 Posts
Based on Daily Candlestick on 22 May (Thursday)
USDCHF
- - Bullish Harami line: “Inside Day”, wait for next signal and look for reversal.
USDJPY
- White inside out up: signalling a bullish reversal: buy signal.
- Bullish Trending Candle Body Reversal : buy signal
This formation shows the market is attempting to rally from these levels. One should look for this market to continue to bottom. If short, cover position.
- Place stop above 102.73, the low of this candle.
EURUSD
- Bearish Harami line: Indecision in market – look for reversal
- Both Candlestick and Stochastics suggest market is overbought.
GBPUSD
- Bullish Harami line: Market is overbought
suggesting the bullish trend is weaking. Overbought, look to cover long position. Trail stop to 1.9683, the current candle low.