• Home
  • Forums
  • Trades
  • News
  • Calendar
  • Market
  • Brokers
  • Login
  • Join
  • User/Email: Password:
  • 4:24am
Menu
  • Forums
  • Trades
  • News
  • Calendar
  • Market
  • Brokers
  • Login
  • Join
  • 4:24am
Sister Sites
  • Metals Mine
  • Energy EXCH
  • Crypto Craft

Options

Bookmark Thread

First Page First Unread Last Page Last Post

Print Thread

Similar Threads

Daily Chart 3-Candle 1,351 replies

Daily Candle On Chart Indicator? 6 replies

Weekly chart with daily candle patterns 2 replies

Day's first H4 candle correlation to daily candle 14 replies

Correlation between first 4 hour candle and daily candle 1 reply

  • Interactive Trading
  • /
  • Reply to Thread
  • Subscribe
  • 10,009
Attachments: Daily candle chart
Exit Attachments

Daily candle chart

  • Last Post
  •  
  • 1 2Page 3456 895
  • 1 Page 3 895
  •  
  • Post #41
  • Quote
  • Feb 23, 2008 4:15pm Feb 23, 2008 4:15pm
  •  hussin naiji
  • Joined Nov 2007 | Status: beginner | 7,605 Posts
chart is clear
Attached Image (click to enlarge)
Click to Enlarge

Name: gbpusd weekly.gif
Size: 14 KB
 
 
  • Post #42
  • Quote
  • Feb 23, 2008 4:32pm Feb 23, 2008 4:32pm
  •  hussin naiji
  • Joined Nov 2007 | Status: beginner | 7,605 Posts
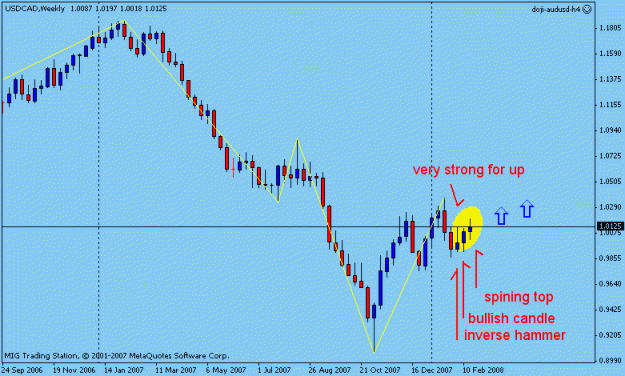
only i can say to u that this pattern that is include from a inverse hammer and abullish candle and also a spining top , have very power for up above 1.0285 . i have considered more 17000 candel for this pattern
Attached Image (click to enlarge)
Click to Enlarge

Name: chfusd.gif
Size: 12 KB
 
 
  • Post #43
  • Quote
  • Feb 27, 2008 6:46am Feb 27, 2008 6:46am
  •  hussin naiji
  • Joined Nov 2007 | Status: beginner | 7,605 Posts
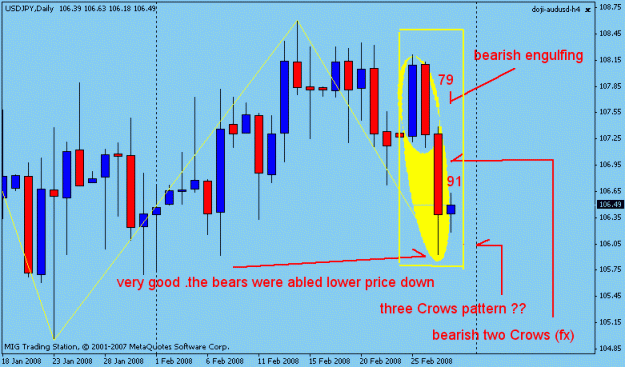
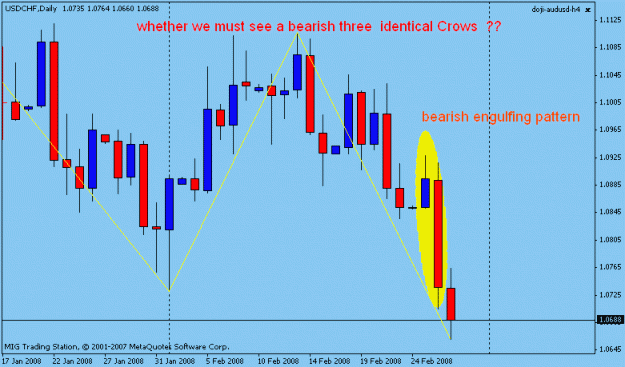
hi all we know that the bearish engulfing pattern is a major reversal pattern .the body of candle (B) completely engulfed the body of candle (A) even we have seen a small uptrend for USDYEN in short term .today we see confirmation from candle (C) .the emotional psychology of the uptrend has now been reversed.we see that sellers have taken over and moved the price below 106.70 .even today the bears were abled to taken price down to 106.18 .whether we must see a bearish three identical Crows pattern next days??
Attached Image (click to enlarge)
Click to Enlarge

Name: 123.gif
Size: 16 KB
 
 
  • Post #44
  • Quote
  • Feb 27, 2008 6:55am Feb 27, 2008 6:55am
  •  hussin naiji
  • Joined Nov 2007 | Status: beginner | 7,605 Posts
chart is clear
Attached Image (click to enlarge)
Click to Enlarge

Name: 123.gif
Size: 15 KB
 
 
  • Post #45
  • Quote
  • Feb 27, 2008 7:05am Feb 27, 2008 7:05am
  •  hussin naiji
  • Joined Nov 2007 | Status: beginner | 7,605 Posts
if this formation remain for the end today , we must see fall for GBPUSD
Attached Image (click to enlarge)
Click to Enlarge

Name: 123.gif
Size: 13 KB
 
 
  • Post #46
  • Quote
  • Feb 27, 2008 8:05am Feb 27, 2008 8:05am
  •  good
  • | Joined Jan 2008 | Status: Member | 326 Posts
Nice analysis for beginners. I am learning candlestick formations and will a close watch on this thread.
 
 
  • Post #47
  • Quote
  • Feb 28, 2008 5:31am Feb 28, 2008 5:31am
  •  hussin naiji
  • Joined Nov 2007 | Status: beginner | 7,605 Posts
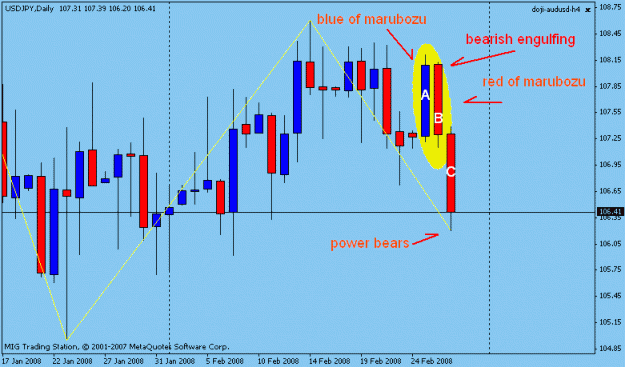
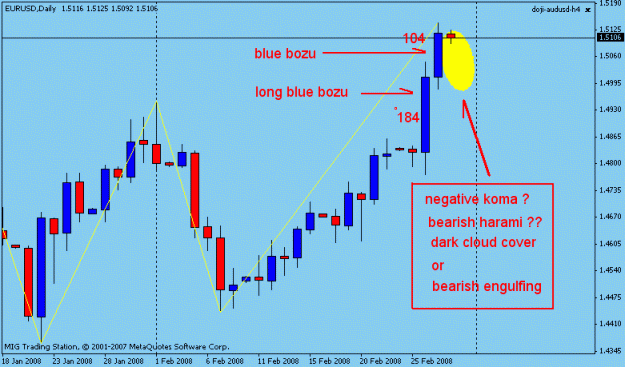
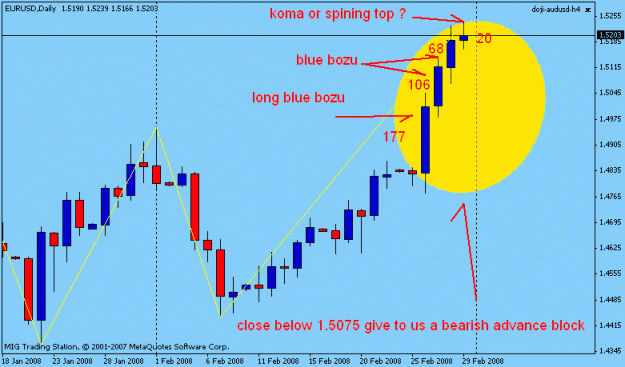
hi all , long blue bozu say to us the more bulls the implications even we see consistent with the prevailing trend in the blue bozu but if be careful we see this now has the bulls concerned because we see a smaller body(blue bozu) against real body of long blue bozu.even i think about opened blue bozu that lower is from closed long blue bozu and upper shadow of blue bozu is very cool .im worried for bulls camp .because blue bozu is top in the uptrend and every moment we must see new events for EUR .this candle has conceived from events .maybe we will see a bearish advance block with new composition (two blue bozu and a red marubozu )that will give to us a bearish advance block or even composition blue bozu with a long red marubozu will give to us a bearish engulfing ?
Attached Image (click to enlarge)
Click to Enlarge

Name: eurusd daily.gif
Size: 14 KB
 
 
  • Post #48
  • Quote
  • Edited at 6:11am Feb 28, 2008 5:41am | Edited at 6:11am
  •  hussin naiji
  • Joined Nov 2007 | Status: beginner | 7,605 Posts
after a small uptrend for USDYEN (104.96 -108.60) we have saw a bearish engulfing pattern that the next day continued and changed from bearish engulfing to bearish two Crows .even we see longer real body for previous day that the more bearish the implications .now has the bulls concerned .even lower shadow the previous day show to us the bears were abled lower price down (105.95). whether this pattern is continuing a bearish three Crows pattern ??


-
Attached Image (click to enlarge)
Click to Enlarge

Name: usdyen daily.gif
Size: 18 KB
 
 
  • Post #49
  • Quote
  • Feb 28, 2008 6:24am Feb 28, 2008 6:24am
  •  hussin naiji
  • Joined Nov 2007 | Status: beginner | 7,605 Posts
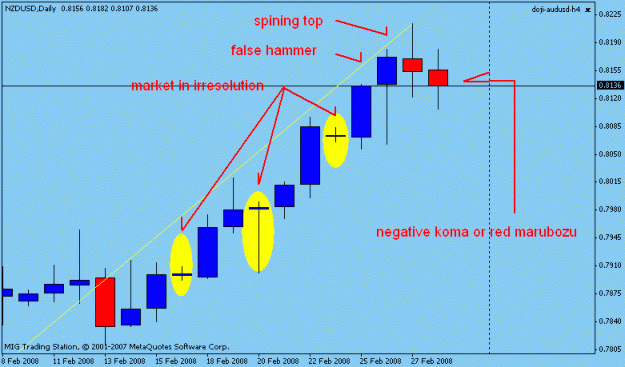
very wonderful is that we see a spining top in the top uptrend (where is that high 23 years for NZDUSD )even opened this spining top below close the previous day and even we see the bears were abled lower price down (close the previous day) whether market is showing to us a irresolution fellow fear with this spining top .even we have saw b4 this spining top ,three candles that show us irresoltion .whether back these candles are more sellers .we know that a spining top is a doji also we know that the dynamic doji is a clear trend reversal signal .maybe we will see a thing similar evening star or abandoned baby of course no exactly similar themselves .


-[/quote]
Attached Image (click to enlarge)
Click to Enlarge

Name: nzdusd.gif
Size: 12 KB
 
 
  • Post #50
  • Quote
  • Feb 28, 2008 6:39am Feb 28, 2008 6:39am
  •  hussin naiji
  • Joined Nov 2007 | Status: beginner | 7,605 Posts
sorry ,daily candle chart AUDUSD is unclear


-[/quote][/quote]
Attached Image (click to enlarge)
Click to Enlarge

Name: audusd.gif
Size: 10 KB
 
 
  • Post #51
  • Quote
  • Feb 28, 2008 6:55am Feb 28, 2008 6:55am
  •  shahroodi
  • Joined Mar 2007 | Status: Member | 1,731 Posts
nice analyses buddhttp://qsmile.com/qsimages/157.gif
but where is your gbp/jpy analyse???http://qsmile.com/qsimages/73.gif http://qsmile.com/qsimages/73.gif
 
 
  • Post #52
  • Quote
  • Feb 28, 2008 6:59am Feb 28, 2008 6:59am
  •  hussin naiji
  • Joined Nov 2007 | Status: beginner | 7,605 Posts
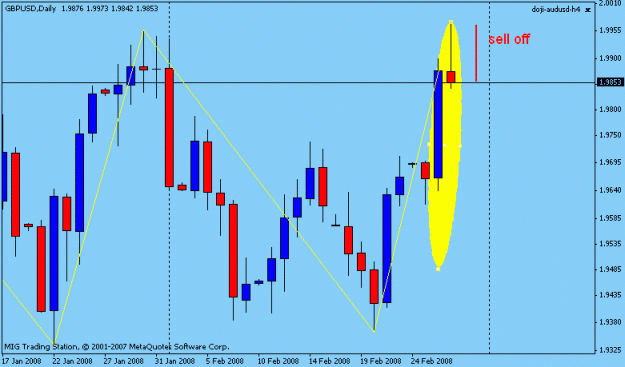
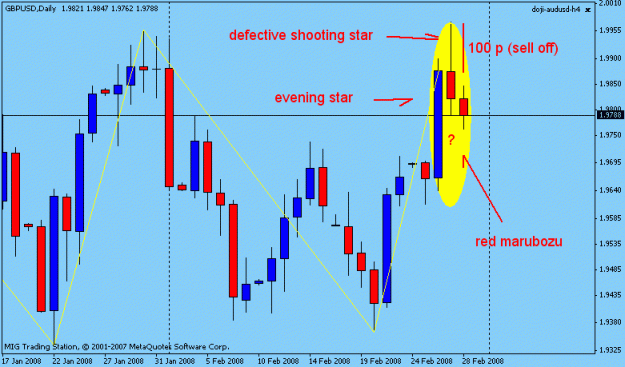
if we see a close for today below 1.9740 .we will see a strong bearish evening star(evening shooting star). of course if previous day was without lower wick .it makes a stronger bearish pattern .let see


-[/quote][/quote][/quote]
Attached Image (click to enlarge)
Click to Enlarge

Name: gbpusd.gif
Size: 15 KB
 
 
  • Post #53
  • Quote
  • Feb 28, 2008 7:17am Feb 28, 2008 7:17am
  •  shahroodi
  • Joined Mar 2007 | Status: Member | 1,731 Posts
Quoting shahroodi
Disliked
nice analyses buddhttp://qsmile.com/qsimages/157.gif
but where is your gbp/jpy analyse???http://qsmile.com/qsimages/73.gif
Ignored
http://qsmile.com/qsimages/73.gif http://qsmile.com/qsimages/57.gif http://qsmile.com/qsimages/164.gif
 
 
  • Post #54
  • Quote
  • Feb 28, 2008 7:19am Feb 28, 2008 7:19am
  •  hussin naiji
  • Joined Nov 2007 | Status: beginner | 7,605 Posts
i see gbpyen below 209.50
Attached Image (click to enlarge)
Click to Enlarge

Name: gbpyen.gif
Size: 15 KB
 
 
  • Post #55
  • Quote
  • Feb 28, 2008 7:22am Feb 28, 2008 7:22am
  •  shahroodi
  • Joined Mar 2007 | Status: Member | 1,731 Posts
Quoting hussin naiji
Disliked
i see gbpyen below 209.50
Ignored
tks matehttp://qsmile.com/qsimages/157.gif
 
 
  • Post #56
  • Quote
  • Feb 28, 2008 9:54am Feb 28, 2008 9:54am
  •  hussin naiji
  • Joined Nov 2007 | Status: beginner | 7,605 Posts
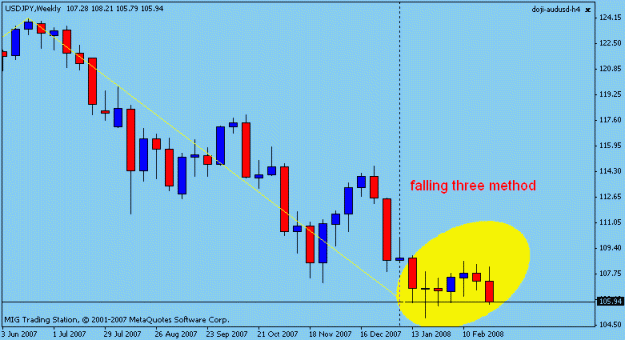
i saw to weekly candle chart USDYEN today ,i faced to a interesting pattern a major candlestick continuation pattern with name falling three method .this isnot signal a reversal pattern . and the Falling Three Method signal is way of confirming that attempted penetration will fail, and that the trend will continue. Recognizing continuation patterns is important
Attached Image (click to enlarge)
Click to Enlarge

Name: usdyen daily.gif
Size: 10 KB
 
 
  • Post #57
  • Quote
  • Feb 29, 2008 4:13am Feb 29, 2008 4:13am
  •  hussin naiji
  • Joined Nov 2007 | Status: beginner | 7,605 Posts
hi all if have attention on market psychology and reaction we see in the daily candle chart EURUSD a fear and interruption .these real bodies what will say to us ?? whether from the more bears in this level ?? or from trend fatigue ?? in any case if close below 1.5075 today we will see a bearish advance block
Attached Image (click to enlarge)
Click to Enlarge

Name: dail eur.gif
Size: 15 KB
 
 
  • Post #58
  • Quote
  • Feb 29, 2008 4:23am Feb 29, 2008 4:23am
  •  hussin naiji
  • Joined Nov 2007 | Status: beginner | 7,605 Posts
i said USDYEN in the weekly candel chart show to us falling three method .chart is clear
 
 
  • Post #59
  • Quote
  • Feb 29, 2008 5:00am Feb 29, 2008 5:00am
  •  hussin naiji
  • Joined Nov 2007 | Status: beginner | 7,605 Posts
when i see two spining top consecutive ,we must exit from bull camp and enter to bears camp .in my incarnation spining top for daily candle chart nzdusd IS A STAR .
Attached Image (click to enlarge)
Click to Enlarge

Name: nnn.gif
Size: 9 KB
 
 
  • Post #60
  • Quote
  • Feb 29, 2008 5:14am Feb 29, 2008 5:14am
  •  hussin naiji
  • Joined Nov 2007 | Status: beginner | 7,605 Posts
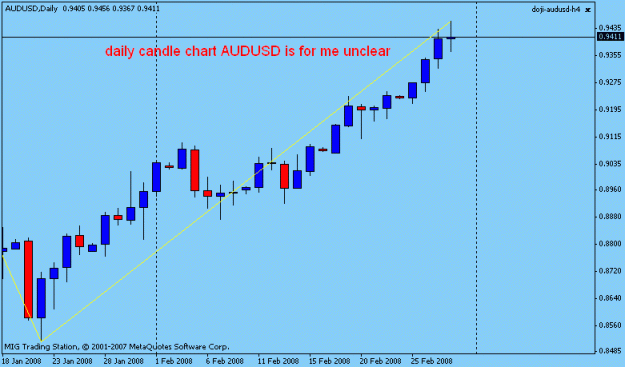
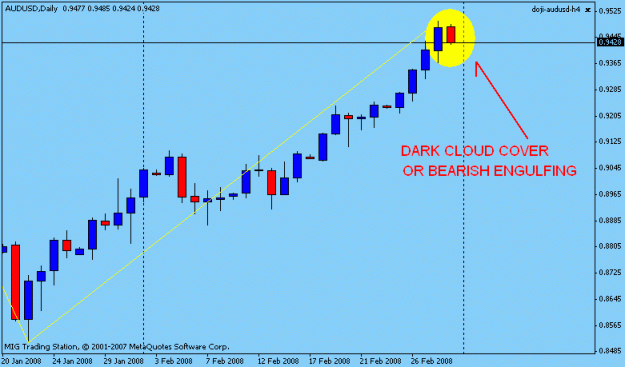
in daily candle chart AUDUSD we see open above prievious day but the bears were abled lower price down ,whether will see in the end today a dark cloud cover or bearish engulfing??
Attached Image (click to enlarge)
Click to Enlarge

Name: nnn.gif
Size: 10 KB
 
 
  • Interactive Trading
  • /
  • Daily candle chart
  • Reply to Thread
    • 1 2Page 3456 895
    • 1 Page 3 895
0 traders viewing now
  • More
Top of Page
  • Facebook
  • Twitter
About FF
  • Mission
  • Products
  • User Guide
  • Media Kit
  • Blog
  • Contact
FF Products
  • Forums
  • Trades
  • Calendar
  • News
  • Market
  • Brokers
  • Trade Explorer
FF Website
  • Homepage
  • Search
  • Members
  • Report a Bug
Follow FF
  • Facebook
  • Twitter

FF Sister Sites:

  • Metals Mine
  • Energy EXCH
  • Crypto Craft

Forex Factory® is a brand of Fair Economy, Inc.

Terms of Service / ©2022