Here is what I'm seeing on the weekly charts.
The red-orange trendline with the zoomed out view shows the major trend.
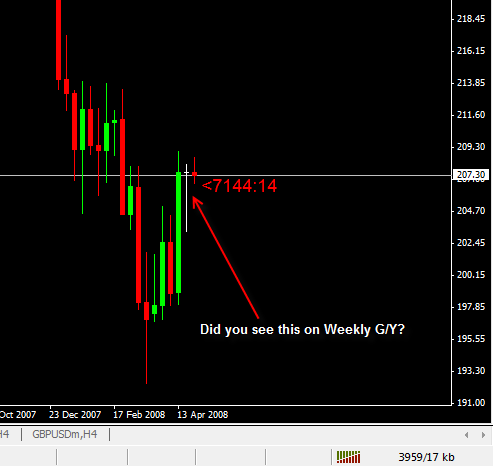
The yellow-orange trendline shows the current trendline I'm working with (keep in mind we have two reference points). We also have a beob (bearish outside bar) showing a possible move down.
On my third chart I have indicated the trendline I'm currently working with and the 50.0% fib retracement. This chart I will be monitoring closely especially if we do drop. If we drop, I'll be watching 1.5150 as this will be the third touch of the trendline and also happens to be the 50.0% fib retracement. IF we break the trendline, we will be heading back down to the red-orange trendline.
The red-orange trendline with the zoomed out view shows the major trend.
The yellow-orange trendline shows the current trendline I'm working with (keep in mind we have two reference points). We also have a beob (bearish outside bar) showing a possible move down.
On my third chart I have indicated the trendline I'm currently working with and the 50.0% fib retracement. This chart I will be monitoring closely especially if we do drop. If we drop, I'll be watching 1.5150 as this will be the third touch of the trendline and also happens to be the 50.0% fib retracement. IF we break the trendline, we will be heading back down to the red-orange trendline.
Attached Image(s) (click to enlarge)