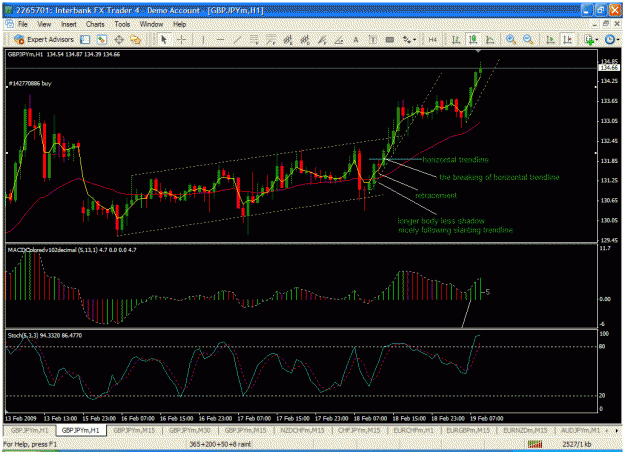
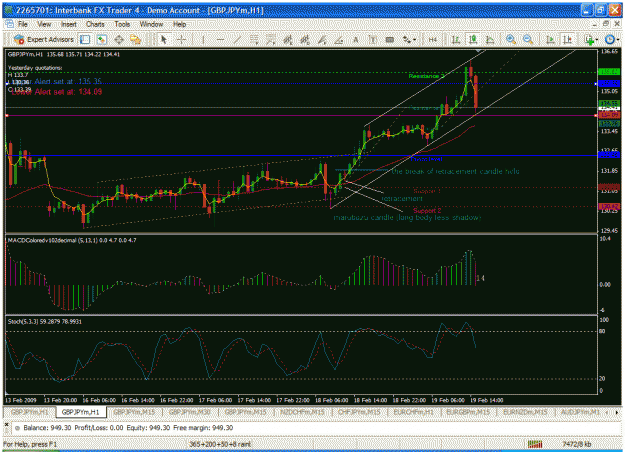
The method is simple enough. I want to cut on the complexity of the method that I previously used. I missed of lot of potential pips using my previous method.
Currency pair: GBP/JPY
Timeframe: 1 hour
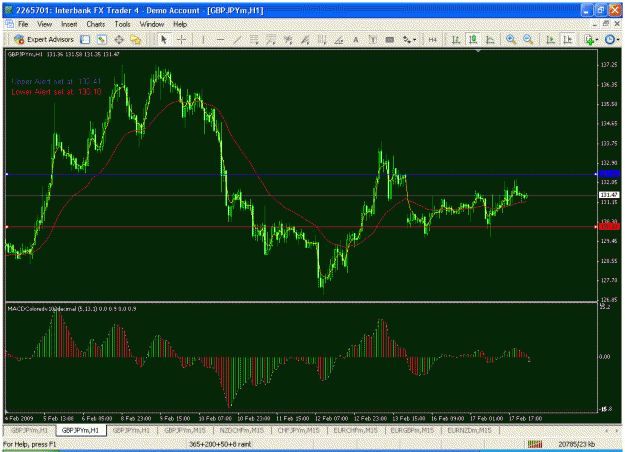
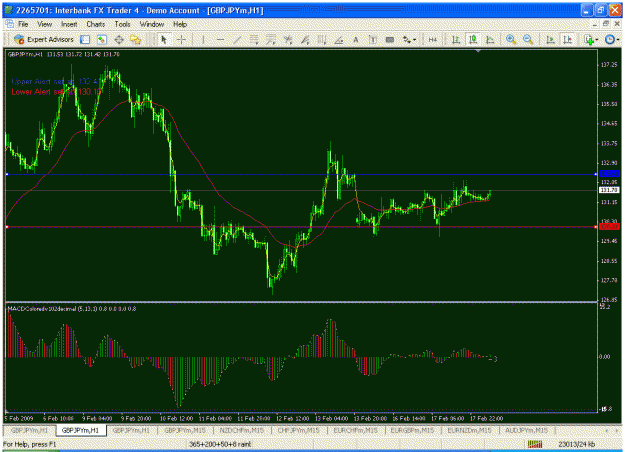
Indicator: 3 ema and 30 ema
macd coloured
Entry:
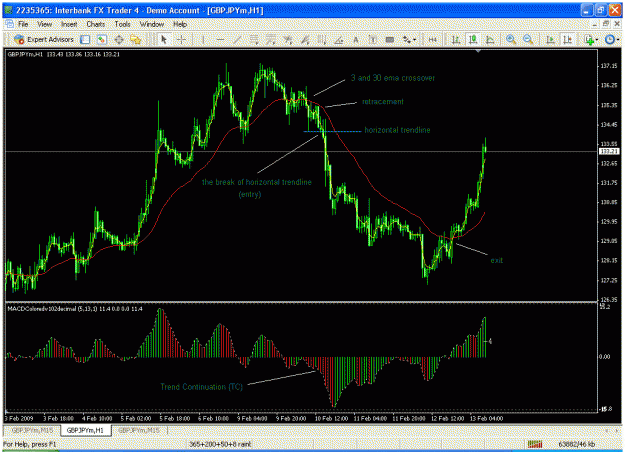
- 3 and 30 ema must crossed first.
- Then I wait for retracement.
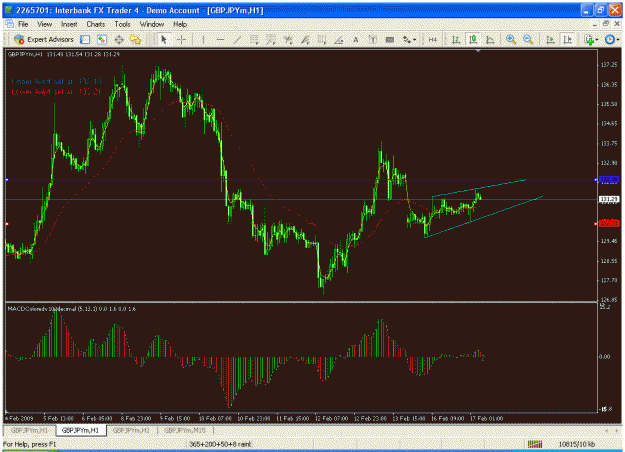
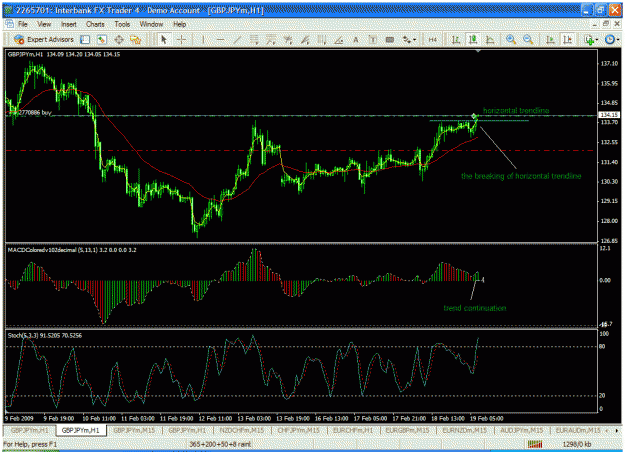
- I would draw horizontal trendline.
- On the break of the horizontal trendline AND On Trend Continuation (TC) as confirmed by macd colored I would enter trade/put order.
*note: for long macd must be up and vice versa.
Exit:
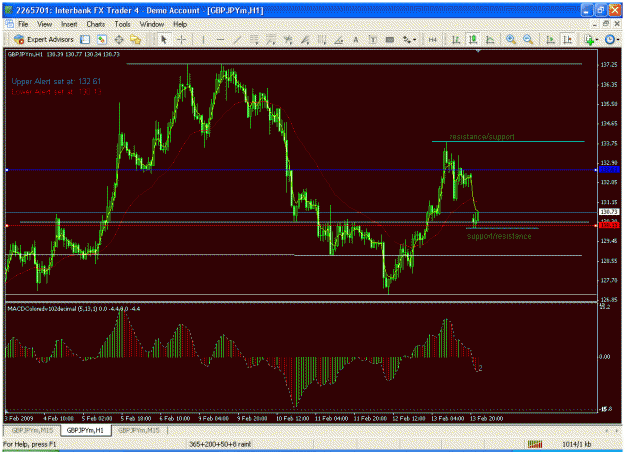
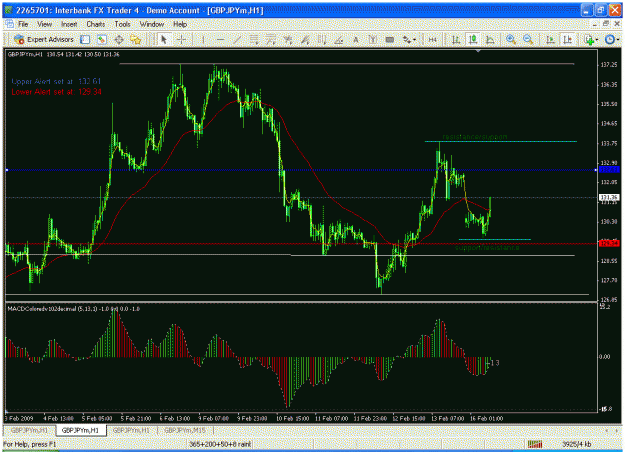
I would put my inital profit target at 400 pips, Stop Loss 200 pips and Trailing Stop at 200 pips which would be adjusted as trades go on.
After entry I would draw slanting trendline. I would exit trades if the trendline is broken.
Another option is to exit when the 3 and 30 ema cross back.
*note on macd:
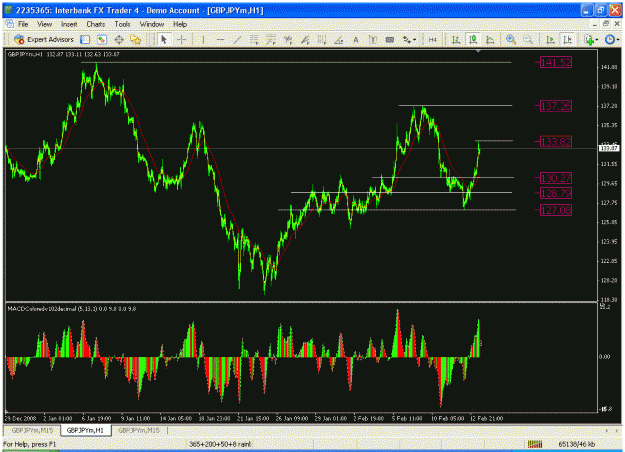
-Usually macd would go as high 15 or -15. Sometimes it would go higher
but rarely. So to enter trade look for the level first and we can guess the
peak or trough.
-If there is divergence on peak or trough it could mean trend about to end
so I would exit trade.
Money Management:
I would adjust the lot so that if I lose it only reduce 5% of my account balance.
Simple enough, I want to test this method for now.
Azzity
13 February 2009.
