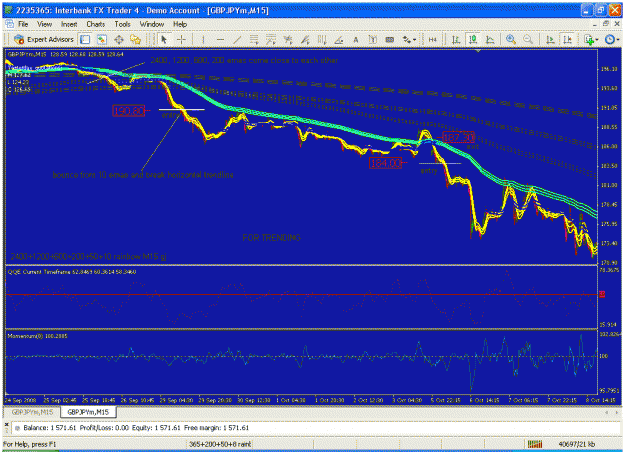
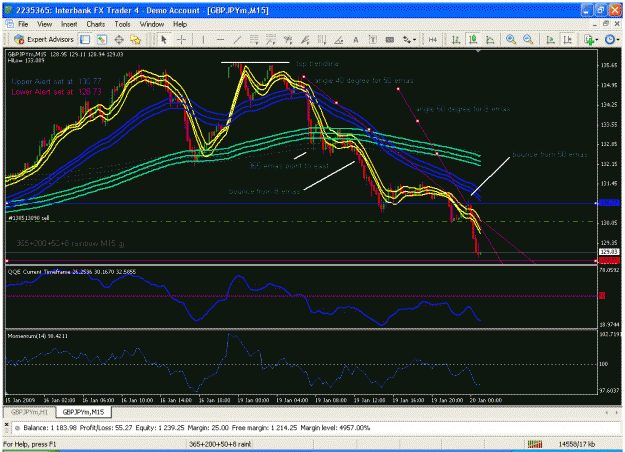
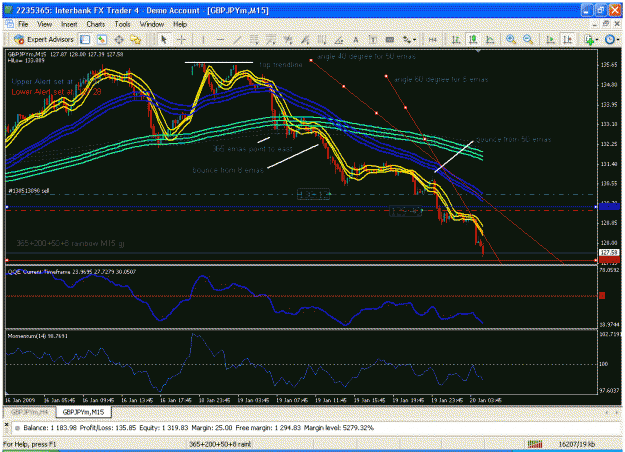
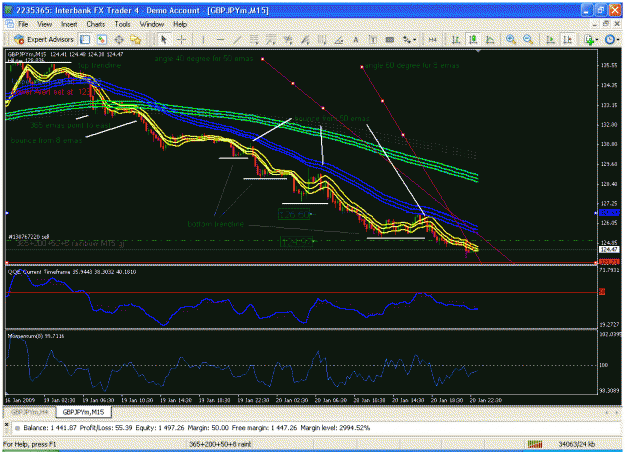
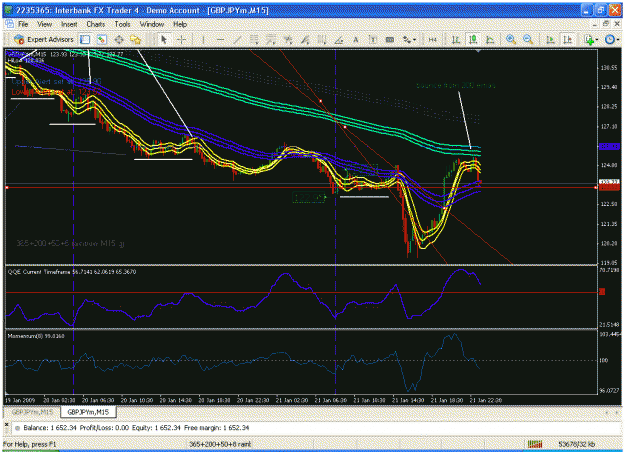
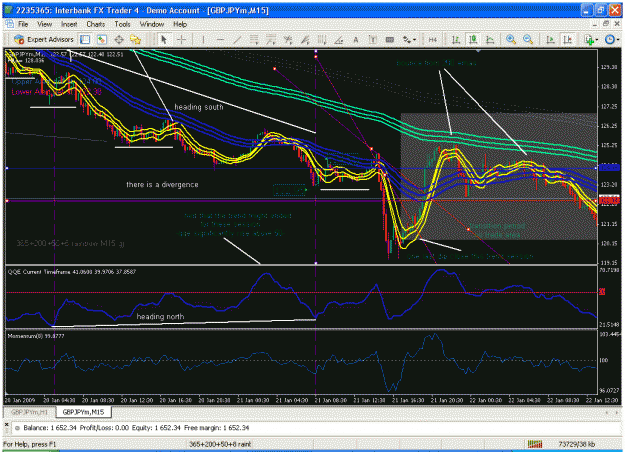
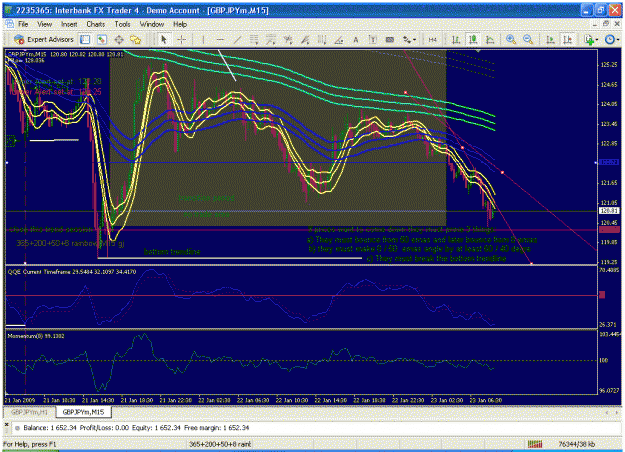
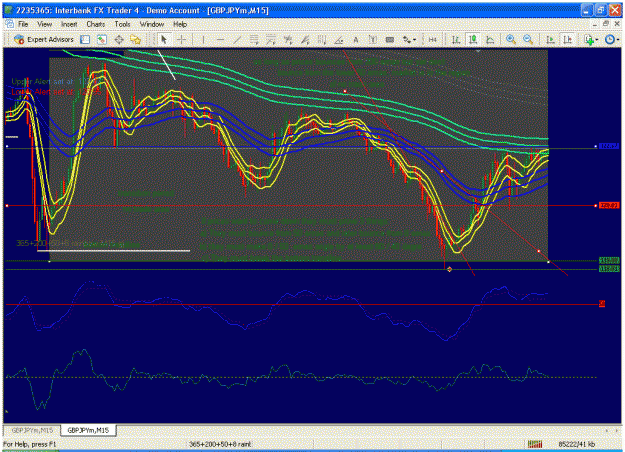
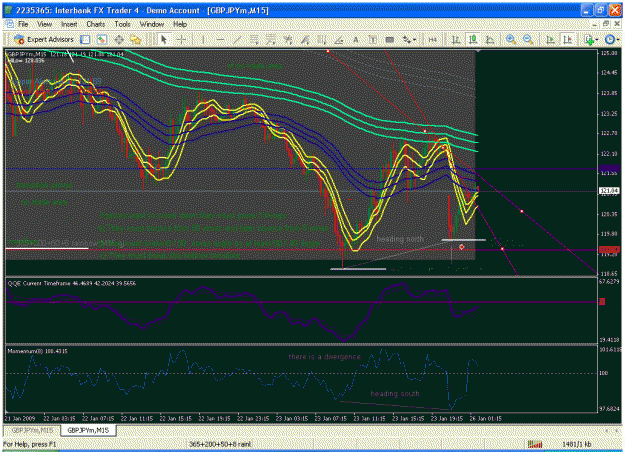
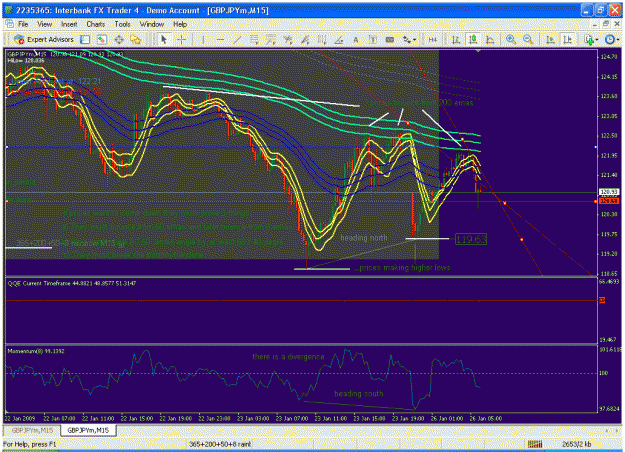
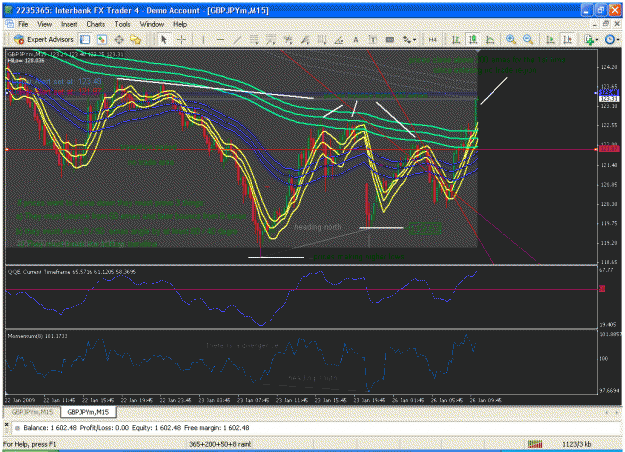
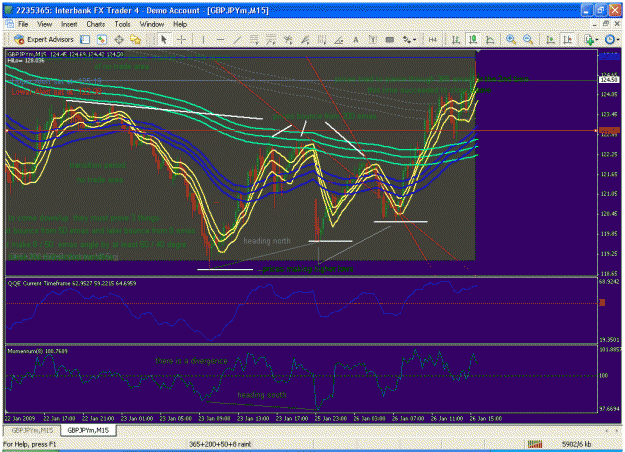
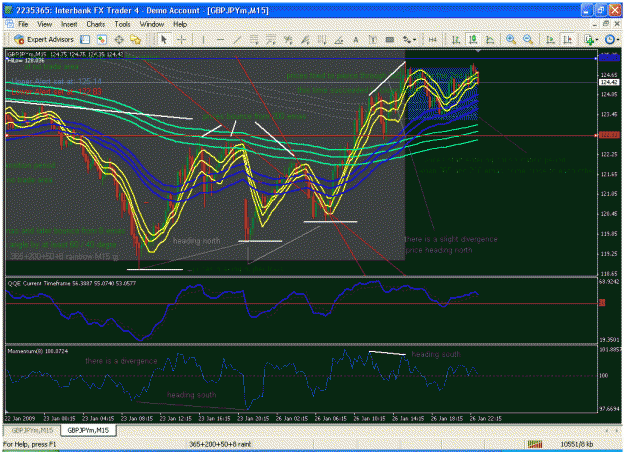
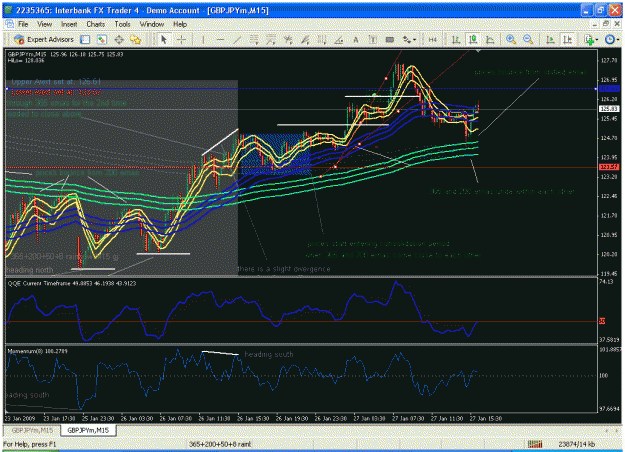
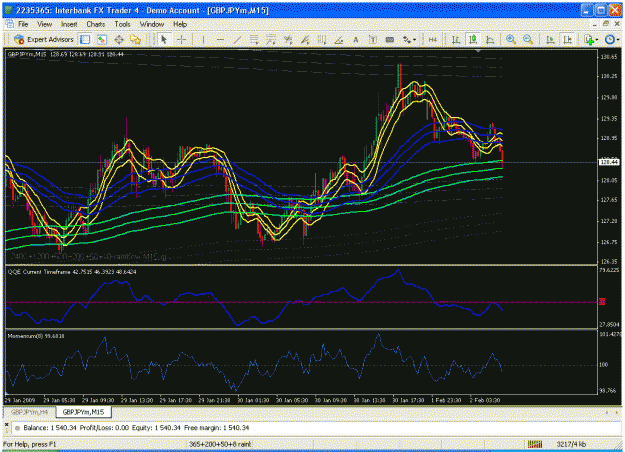
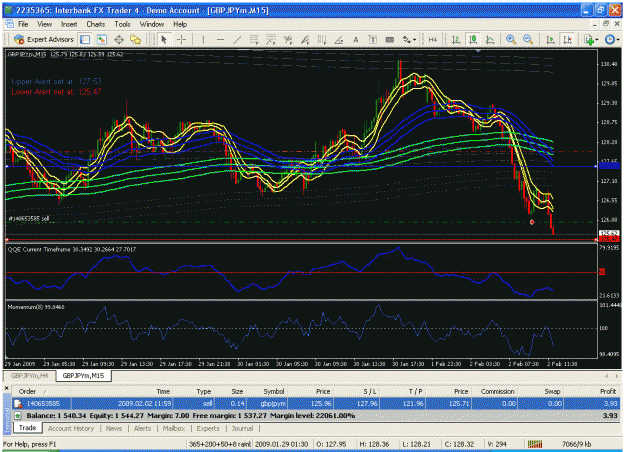
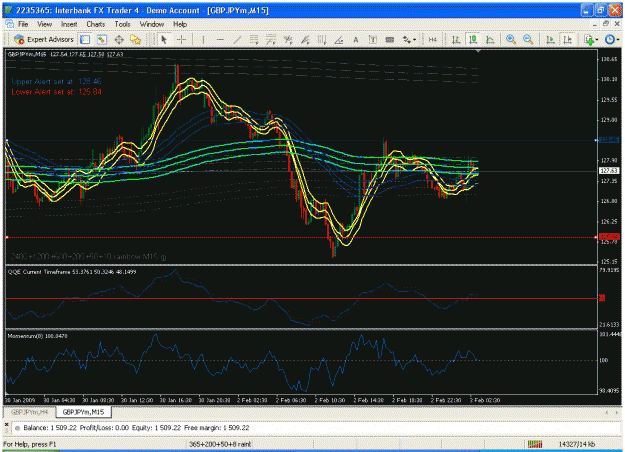
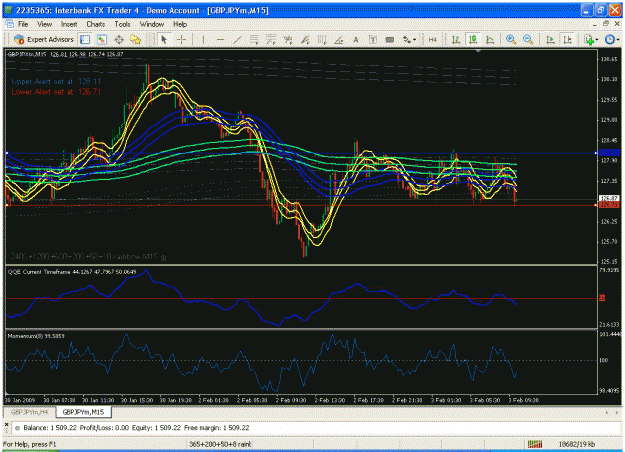
I started this thread to test and find consistency needed to make successful trades. Before this I started Trading Journal I.
In this journal, I formulate my own trading system based on my own observation of the market rhythm.
And I shall call this method the "2400+1800+1200+600+200+50+8 rainbow M15 gj".
I only use gbp/jpy pair for this method.
I only use M15 chart.
I only use moving averages and price actions.
a) sma 8, ema 50, ema 200, ema 600, ema 1200, ema 1800 and ema 2400
-these lines are to be viewed as support and resistance lines. The higher the ema the stronger
support and resistance. Crosses of ema lines don't mean anything here. It's the location of
prices relative to the the lines that's important. If say price is located between 600 ema above
and 50 ema below it means that the price is located between a stronger resistance (600 ema)
and a weaker support (50 ema).
b) qqe and momentum indicators as additional helpers
***********************************************************
Market Rhythm
Before writing notes on entry/exit I want to make clear of Market Rhythm that I have been observing.
There are two situations:
a) Prices would cut through or bounce from higher ema to lower ema,
this is main trend.
When prices depart away from higher emas lines, the market is trending,
or continue trending after retracement.
The ema lines would depart from each other, or simply call 'gap opening'.
b) Prices would cut through from lower ema to higher, this is during retracement.
If prices retrace after trending, they would retrace back to the next
higher level emas. Meaning the lines would come closer to their
higher emas, or simply call 'gap closing'.
-Say, if prices retrace and cut through 8 emas, they would at least go
back to their higher emas, that's 50 emas.
-And if prices don't bounce but cut through 50 emas, they would at least go back to their higher emas, that's 200 emas.
-And if prices don't bounce but cut through 200 emas, they would at least go back to their higher emas, that's 600 emas.
-And if prices don't bounce but cut through 600 emas, they would at least go
back to their higher emas, that's 1200.
-And if prices don't bounce but cut through 1200 emas, they would at least go back to their higher emas, that's 1800.
-And if prices don't bounce but cut through 1800 emas, they would at least go back to their higher emas, that's 2400.
*************************************************************
Entry:
For main trend
a) Look for the area where the higher emas are close to each other. The more
the higher emas are close to each other the better. The best is when all 4 higher
emas that's 2400,1800,1200,600 and 200 are close to each other.
b) Wait for the cut through or bounce from higher emas to lower emas. From 2400,1800,1200,600 and 200 emas. Observe the cut through or bounce right through until
above/below 200 emas,
c) Then wait for retracement or sideways area.
d) Then look for bounce from the 8 or 50 ema and/or the break of bottom/top trendline.
e) At the break of bottom/top trendlines (referring to c above) plus 20 pips
I would put my order.
For retracement
For taking retracement, I have to make sure the gap between the ema pair
is wide, enough room to take profits.
a) Prices pierce through lower ema of the ema pair and close above/below the lower emas high/low line.
b) qqe showing reverse direction.
c) Momentum showing retracement, hook up/down.
d) Break a horizontal trendline.
e) I would put order 20 pips above/below the trendline
Target profit:
400 pips initial target.
Would adjust as prices hike up or going down.
Stop loss:
2 choice
a) 200 pips fixed
b) A few pips from the top/bottom trendline identified as per my judgement.
Money management:
I would adjust the entry lot so that the stop loss would only be 2% of my account balance.
Trailing:
200 pips. This is to minimize lose or get some profits in case prices turnaround before reach initial target of 400 pips.
Exit:
For trending-2 choice
a) After the price pierce back through the top/bottom of 200 ema.
b) According to my judgements.
For retracement-2 choice
a) When prices reach the next higher ema.
b) When prices bounce from the much higher ema.
Azzity.
29 January 2009.
****************************************************************************
Note:
This thread was originally written on 19 January 2009. But after observing the price actions since then I decided to revamp the method to be as above.
Posts no 2 through 16 are to be skipped. Those are my earlier learning processes.
I'll focus in this method now and see how it goes.
Azzity.
28 January 2009.
-Azzity
