XAUUSD Weekly Technical Outlook
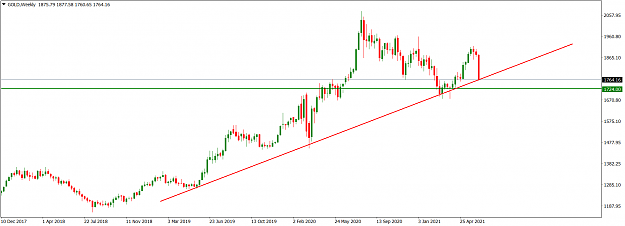
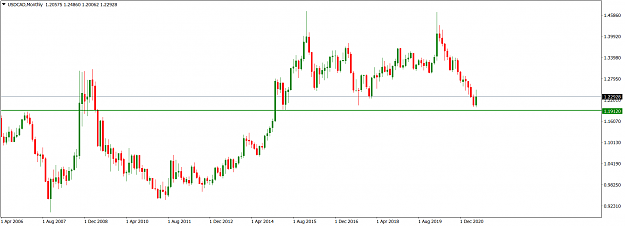
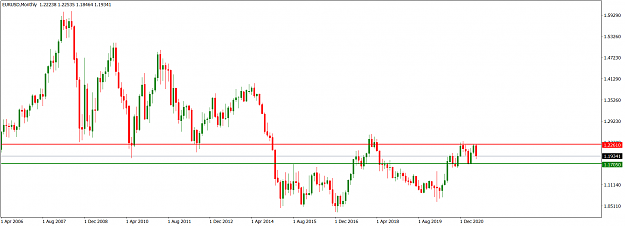
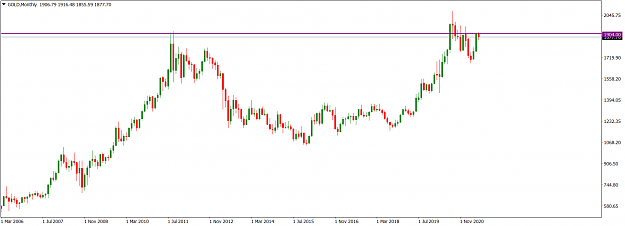
The 1904.00 area (purple) is presently the horizontal resistance for XAUUSD market operation on the monthly time frame. The May bullish candlestick nestled in the area while the interim June candlestick took a southward turn from the area. Although the general technical structure still favours bulls more than bears, presently, the market operating mode is witnessing an increased bearish pressure.
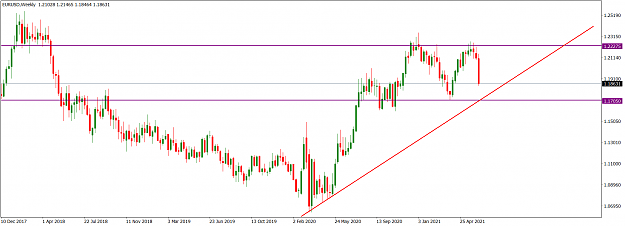
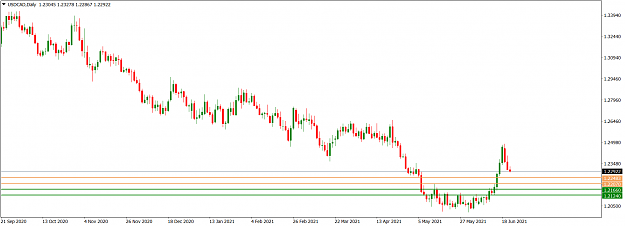
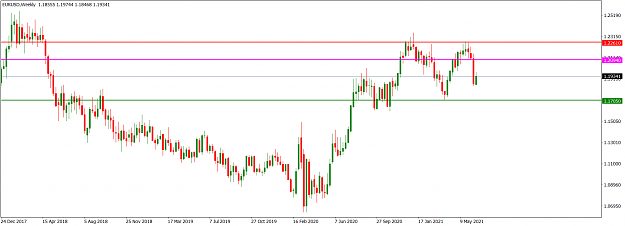
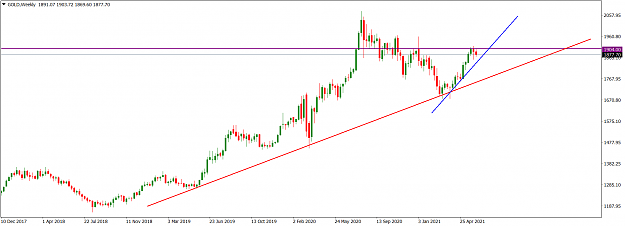
The market operation on the weekly time frame is sideways but technicals still favour bulls. An inner rising trendline (blue) is still active, while an outer rising trendline (red), which is a long way off, may be consequential in future. Nevertheless, as the market operation is presently around the 1904.00 horizontal resistance area (purple), we may still see some sideways of market operation. Any bullish misstep may incentivize bears.
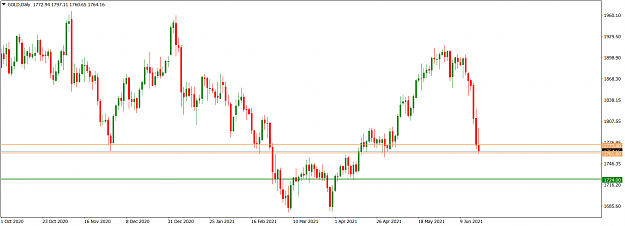
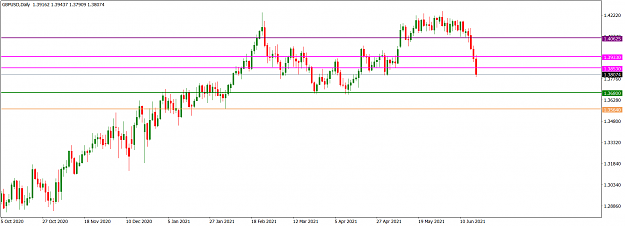
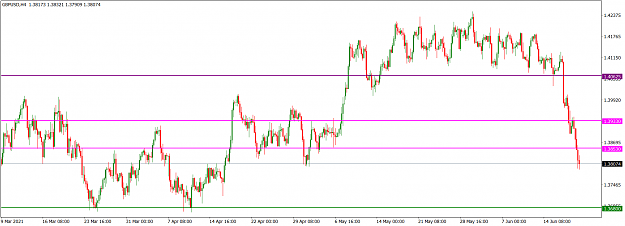
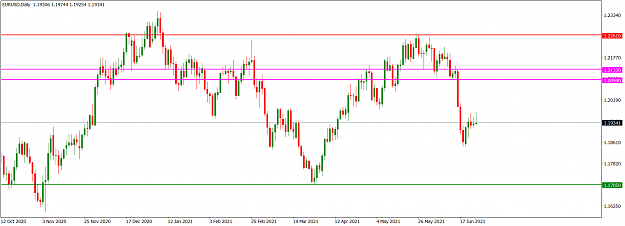
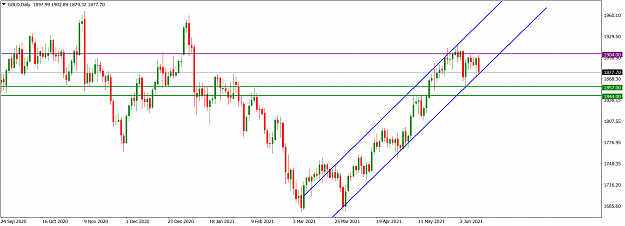
On the daily time frame, technicals and order flow context still favour bulls even though there is increased bearish pressure. Price action is in a rising wedge (blue). Presently it is retesting the channel support trendline in the context of a consolidating mode. Nevertheless, any bullish misstep in the early part of this week may incentivize bears for a southward move to an area of value, such as the 1857.00/1844.00 horizontal support area (green).
I may be wrong. Trade safe and prosper.
KP
The 1904.00 area (purple) is presently the horizontal resistance for XAUUSD market operation on the monthly time frame. The May bullish candlestick nestled in the area while the interim June candlestick took a southward turn from the area. Although the general technical structure still favours bulls more than bears, presently, the market operating mode is witnessing an increased bearish pressure.
Attached Image (click to enlarge)
The market operation on the weekly time frame is sideways but technicals still favour bulls. An inner rising trendline (blue) is still active, while an outer rising trendline (red), which is a long way off, may be consequential in future. Nevertheless, as the market operation is presently around the 1904.00 horizontal resistance area (purple), we may still see some sideways of market operation. Any bullish misstep may incentivize bears.
Attached Image (click to enlarge)
On the daily time frame, technicals and order flow context still favour bulls even though there is increased bearish pressure. Price action is in a rising wedge (blue). Presently it is retesting the channel support trendline in the context of a consolidating mode. Nevertheless, any bullish misstep in the early part of this week may incentivize bears for a southward move to an area of value, such as the 1857.00/1844.00 horizontal support area (green).
Attached Image (click to enlarge)
I may be wrong. Trade safe and prosper.
KP
Do your homework, follow the footprints of smart money