"Have you ever seen on the graph are the levels of supply and demand, which would be so obvious that you almost know what price will be developed there in the future? This is the ability to easily develop, with the small amount of time spent studying charts. But you've -nibud asked why the price will be developed in the future, there is a psychological reason why the price level will test the question arises, why are these levels of work simplified can be explained as follows:?. What do you do when you remember something pleasant I assume that you repeat? so as long as it does not cease to be. If you talk about the short path, which reduces the movement in half, you'll use it again and again? Without a doubt! same good memories of working in the trade. If you've got to come when trading on a certain price level of supply and demand, you would repeat it when the price would go back there in the future? Certainly! "
Sam Seiden
Good day dear traders My name is Andrei Shvedov. I trade on levels of demand and supply more than 10 years. I'm sure many of you who trades in the zones used my indicator Shved Supply and Demand. But in this indicator, there are serious problems, he like the rest of his kind all version supdem, in fact it does not reflect the areas and working on a pivot. Let me explain where in the indicator supdem where in the display appears the demand and supply area is in fact a first test earlier formed zone. It's not bugging me for a long time, I analyzed the situation, and so was born the indicator Shved SupDem-Pro Zone which is several times more precisely defines the zone on all possible timeframes and on any instrumentam.V some cases, it even complicates the work (greater accuracy).
Let us analyze what is the supply and demand and how important expression of the memory market.
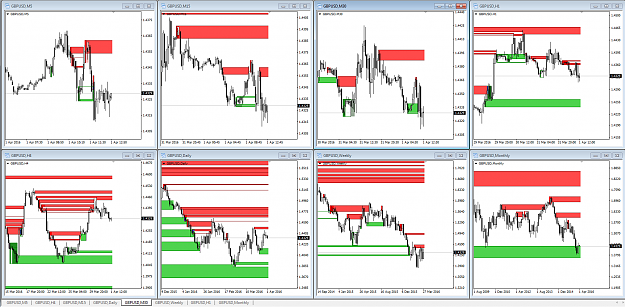
The screenshot shows the operation indicator proprietary supdem-pro he yavlyaetsya improved version of my previously written indicator
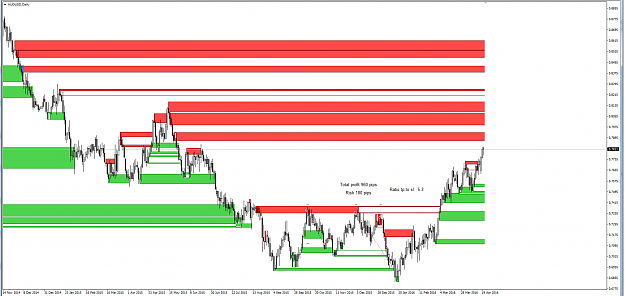
Shved Supply and Demand to create it, I almost gave up the trade for 3 years and acquainted with the mass of literature, at this time I am not selling but only analyze the behavior of prices in different situations. It took quite a long time so that I could properly articulate the programmer to the task. The indicator looks for areas in which there is an imbalance between supply and demand, and displays them on the charts for any instruments and timeframes. Red zone -zone offers dominated by sellers. Green Zones -zone demand dominated by buyers.
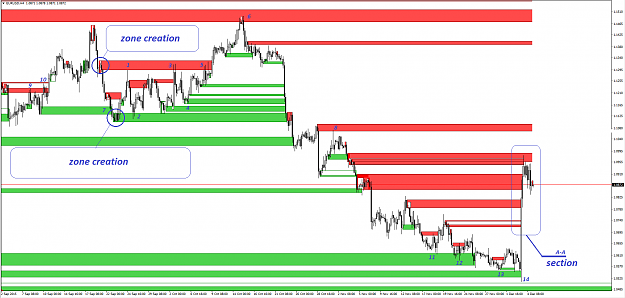
Chart Eur / Usd for 4 hours. All around, the formation of supply and demand zones. At point 1 is likely to have already experienced traders are located all configured to sales because they know that their chances of above 50% of the price will start to decline in the first zone of the test proposals and sellers win annoying customers. But buyers gathered with the spirit managed to stop them at the point 2.
At point 3 sellers are still in the lead they continue to sell, but to restrain buyers become more and more difficult. This is the second price zone test is passed even higher from the previous high point 1. In point 5 was simply a war between buyers and sellers, which lasted the whole day, each side fought to the last, but still at the end of the day customers won and began to push the price higher and higher and higher with almost no kickback.
However, sellers are prepared for the next meeting at 6 and were ready buyers had little chance to take them by storm. At points 7,8,9,10 shows how the price reacts to supply and demand zones. At points 11, 12, 13, we are approaching the daily chart area demand and price zamedlyaetsya smoothly. In point 14 it is very close to the area of demand for a daily chart of the result of the movement of 450 points.
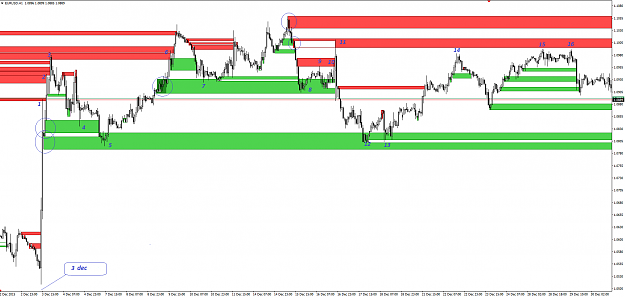
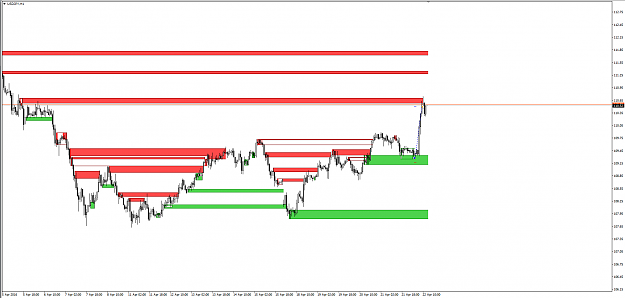
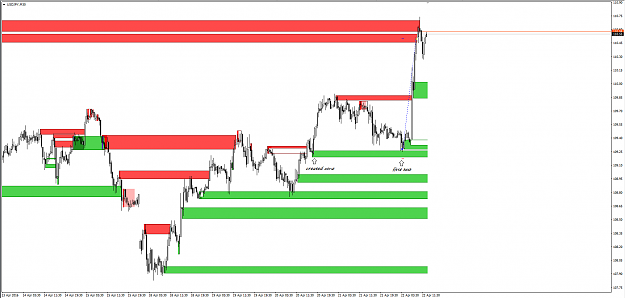
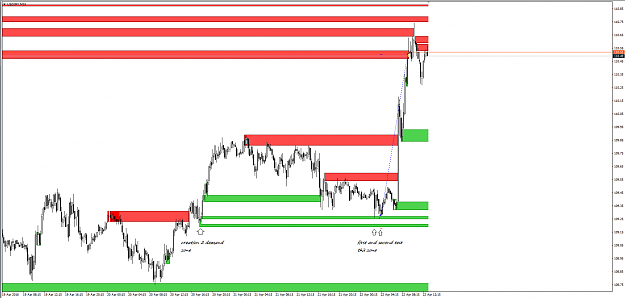
Let's carry out the analysis of price movement on the chart marked Eur / Usd H4, as the cut A-A only on a smaller timeframe H1, to understand how the supply and demand of the zone so to speak under the microscope. Our movement was December 3rd.
Circles marked the formation of supply and demand zones. At points 1,2,3 prekrastno shows how the price is trying to overcome the zone formed earlier proposals. After the price could not overcome proposals zone at point 3, it pulls back to the short supply of the newly formed zone. The reaction to these zones is the behavior of prices in points 4 and 5. After the price correction still pushes proposals zone at 6. But the higher up is not because the area is limited to the last proposal which failed to break through on the H4. Once again, the price is looking to consolidate blizhayushuyu zone demand response point 7 and 8. On the way up to be another fresh proposals zone - the reaction points 9, 10, 11. After the failure of the price starts to move to the nearest point of the zones 12, 13, 14, 15.
Outcome: supply and demand zones are everywhere and always on any instrument and any time frame is the basic laws of the market new traders should start with this.
my site & blog supdem-pro.com
Sam Seiden
Good day dear traders My name is Andrei Shvedov. I trade on levels of demand and supply more than 10 years. I'm sure many of you who trades in the zones used my indicator Shved Supply and Demand. But in this indicator, there are serious problems, he like the rest of his kind all version supdem, in fact it does not reflect the areas and working on a pivot. Let me explain where in the indicator supdem where in the display appears the demand and supply area is in fact a first test earlier formed zone. It's not bugging me for a long time, I analyzed the situation, and so was born the indicator Shved SupDem-Pro Zone which is several times more precisely defines the zone on all possible timeframes and on any instrumentam.V some cases, it even complicates the work (greater accuracy).
Let us analyze what is the supply and demand and how important expression of the memory market.
The screenshot shows the operation indicator proprietary supdem-pro he yavlyaetsya improved version of my previously written indicator
Shved Supply and Demand to create it, I almost gave up the trade for 3 years and acquainted with the mass of literature, at this time I am not selling but only analyze the behavior of prices in different situations. It took quite a long time so that I could properly articulate the programmer to the task. The indicator looks for areas in which there is an imbalance between supply and demand, and displays them on the charts for any instruments and timeframes. Red zone -zone offers dominated by sellers. Green Zones -zone demand dominated by buyers.
Chart Eur / Usd for 4 hours. All around, the formation of supply and demand zones. At point 1 is likely to have already experienced traders are located all configured to sales because they know that their chances of above 50% of the price will start to decline in the first zone of the test proposals and sellers win annoying customers. But buyers gathered with the spirit managed to stop them at the point 2.
At point 3 sellers are still in the lead they continue to sell, but to restrain buyers become more and more difficult. This is the second price zone test is passed even higher from the previous high point 1. In point 5 was simply a war between buyers and sellers, which lasted the whole day, each side fought to the last, but still at the end of the day customers won and began to push the price higher and higher and higher with almost no kickback.
However, sellers are prepared for the next meeting at 6 and were ready buyers had little chance to take them by storm. At points 7,8,9,10 shows how the price reacts to supply and demand zones. At points 11, 12, 13, we are approaching the daily chart area demand and price zamedlyaetsya smoothly. In point 14 it is very close to the area of demand for a daily chart of the result of the movement of 450 points.
Let's carry out the analysis of price movement on the chart marked Eur / Usd H4, as the cut A-A only on a smaller timeframe H1, to understand how the supply and demand of the zone so to speak under the microscope. Our movement was December 3rd.
Circles marked the formation of supply and demand zones. At points 1,2,3 prekrastno shows how the price is trying to overcome the zone formed earlier proposals. After the price could not overcome proposals zone at point 3, it pulls back to the short supply of the newly formed zone. The reaction to these zones is the behavior of prices in points 4 and 5. After the price correction still pushes proposals zone at 6. But the higher up is not because the area is limited to the last proposal which failed to break through on the H4. Once again, the price is looking to consolidate blizhayushuyu zone demand response point 7 and 8. On the way up to be another fresh proposals zone - the reaction points 9, 10, 11. After the failure of the price starts to move to the nearest point of the zones 12, 13, 14, 15.
Outcome: supply and demand zones are everywhere and always on any instrument and any time frame is the basic laws of the market new traders should start with this.
my site & blog supdem-pro.com
Attached Image(s) (click to enlarge)