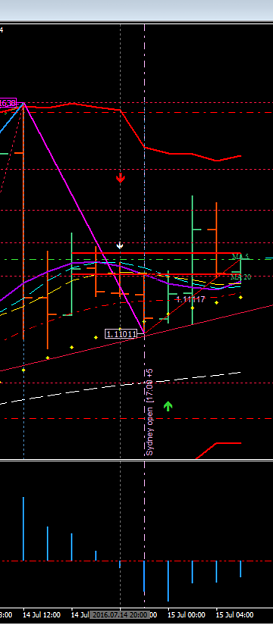
• Home
  • Forums
  • Trades
  • News
  • Calendar
  • Market
  • Brokers
  • Login
  • Join
  • User/Email: Password:
  • 8:13pm
Menu
  • Forums
  • Trades
  • News
  • Calendar
  • Market
  • Brokers
  • Login
  • Join
  • 8:13pm
Sister Sites
  • Metals Mine
  • Energy EXCH
  • Crypto Craft

Options

Bookmark Thread

First Page First Unread Last Page Last Post

Print Thread

Similar Threads

Paradox System: post your entry here 12 replies

Paradox system avg monthly ROR for last 12 months 33 replies

Learning the Paradox System=Set up / Trade Plan / Results Only 1 reply

MTS Vs Random Entry - A Paradox 6 replies

lets talk about the system called PARADOX 2 replies

  • Trading Systems
  • /
  • Reply to Thread
  • Subscribe
  • 4,250
Attachments: The Paradox System
Exit Attachments
Tags: The Paradox System
Cancel

The Paradox System

  • Last Post
  •  
  • 1 303304Page 305306307 863
  • 1 Page 305 863
  •  
  • Post #6,081
  • Quote
  • Jul 14, 2016 12:41pm Jul 14, 2016 12:41pm
  •  Jens89
  • | Joined Jun 2016 | Status: Member | 85 Posts
Quoting savanhws
Disliked
{quote} According to your graph; Shouldn't ROMAR / EMA be support, and the three horsemens (also acting like support, I thinl) are pointing up for a long? and DB is also attached to the candle for a move up?
Ignored
just to be sure you're talking about the 2 hour?

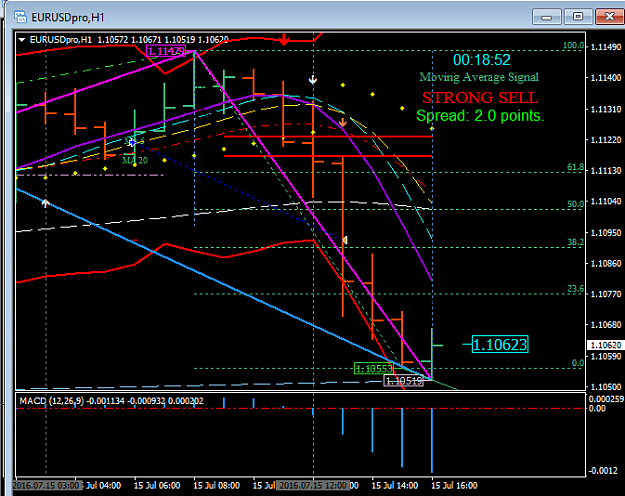
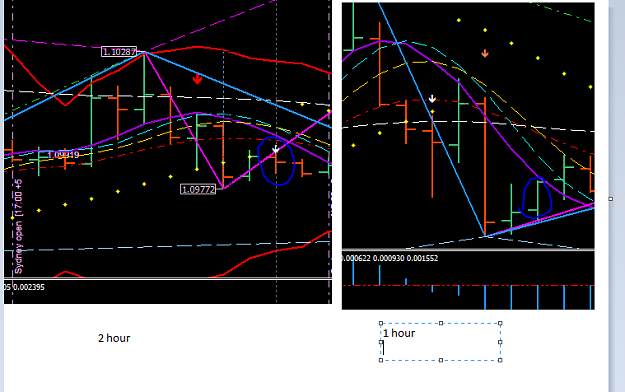
at the point of entry ROMAR is above EMA so that means ROMAR is resistance. besides that the parabolic is on top and white and smooth are above purple.

make sure you look at THE POINT OF ENTRY.

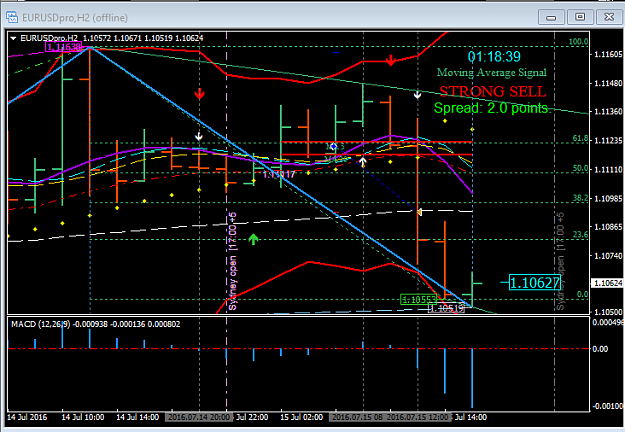
at the end of the chart ROMAR is indeed support as it is below EMA (EMA just slightly above ROMAR) and the horsemen are going up.
 
 
  • Post #6,082
  • Quote
  • Jul 15, 2016 7:05am Jul 15, 2016 7:05am
  •  Elflaco
  • | Joined May 2016 | Status: Member | 132 Posts
Quoting Jens89
Disliked
Also A trade I'd like to discuss and get some opinions on: EURUSD 2 HOUR {image} EURUSD 1 HOUR {image} I shorted for the following reasons: 2 hour at the moment of entry: ROMAR resistance, EMA was just getting below ROMAR for also being resistance. smooth, white, purple and the parabolic are all set up to short. 1 hour at the moment of entry: ROMAR, parabolic, EMA, smooth resistance. purple crossed white to put it in consolidation which I found the only thing which didn't align for the short but all the other indicators are showing heavy resistance....
Ignored
Hi Jens,

You're talking about the entry at 11-07 at 10.00 right? Because you said "EMA was just getting below ROMAR" it was a little confusing. I think that is why savanhws looked at the right side of the graph you posted.

This is why I think it was not a good entry:
The 1 hour was in consolidation with Purple/White crossing and an open candle above the Parabolic, which indicates a flip for the up on the next 1-2 candles and you had the MACD arrow for the up. On the 2 hour Purple/White/Smooth are very tight and you had the SAR attached to the bottom of the previous 2 candle, which indicates the next target will be up. At the time of your entry I think the fibo was green with the new down it did on the previous 2 candle.

In my opinion there where more confluence factors indicating a swing up than there where for a down. But with ROMAR resistance being close I don't think there was any trade on at that moment.
 
 
  • Post #6,083
  • Quote
  • Edited 2:39pm Jul 15, 2016 12:45pm | Edited 2:39pm
  •  Jens89
  • | Joined Jun 2016 | Status: Member | 85 Posts
my long trade of today on EURUSD


Attached Image (click to enlarge)
Click to Enlarge

Name: EURUSD 1 HOUR.PNG
Size: 31 KB


Attached Image (click to enlarge)
Click to Enlarge

Name: EURUSD 2 hour.PNG
Size: 34 KB


at the moment of entry we were getting above white with all horsemen, EMA and ROMAR ready for the uptrend.
on the 1 hour trend the candle opened with purple getting above smooth also ready for the uptrend.

I think this was a good entry but I got unlucky. I was away from my desk and let the trade run during the day, else I think I would have gotten out with the purple / white crossing for the down with the open under EMA on the 1 hour.


edit: the strong US data are probably what caused the change in trend
 
 
  • Post #6,084
  • Quote
  • Edited 2:39pm Jul 15, 2016 12:53pm | Edited 2:39pm
  •  Jens89
  • | Joined Jun 2016 | Status: Member | 85 Posts
Quoting Elflaco
Disliked
{quote} Hi Jens, You're talking about the entry at 11-07 at 10.00 right? Because you said "EMA was just getting below ROMAR" it was a little confusing. I think that is why savanhws looked at the right side of the graph you posted. This is why I think it was not a good entry: The 1 hour was in consolidation with Purple/White crossing and an open candle above the Parabolic, which indicates a flip for the up on the next 1-2 candles and you had the MACD arrow for the up. On the 2 hour Purple/White/Smooth are very tight and you had the SAR attached to...
Ignored
thanks for your comments. I'm indeed talking about that entry. on the 2 hour the EMA was just getting below ROMAR at that time but I know it wasn't very visible.

what you say makes sense indeed. what I find the hardest in analyzing the entries is that we have to judge it from where the trades open as in the candle opening above smooth or EMA or whatever. cause if you purely look at the indicators on the 2 hour they were all signaling down. I know about the purple/white crossing indeed on the 1 hour but it also happens that they just slightly cross and then we are moving down again. in hindsight it's of course easier to say but it also could have been a retracement to smooth to then go downhill again.
 
 
  • Post #6,085
  • Quote
  • Jul 16, 2016 4:53am Jul 16, 2016 4:53am
  •  Elflaco
  • | Joined May 2016 | Status: Member | 132 Posts
I you just look at the 4 horsemen, EMA and ROMAR, then you're right. But the SAR attachment was a signal for the market heading in the opposite direction and the MACD arrow up indicated the same. That is why dove_alliance always talks about the big picture, you have to see everything that is happening in the moment, not just a part of it. What helps to determine wheter it's a good entry or not for me is by only enter on a new opening H2 candle, and therefore also a new opening H1 candle. The indicators move at that point and give a solid indication if the entry that is on your daily plan is to come or not.

While you're trading everyday, also keep reading everything that dove_alliance has stated and the best way to do that is by downloading and printing the 9 summaries that TradeALot made. If you keep reading them over and over everytime a new piece of the puzzle falls into place. At least that is what's happening everytime I read them ;-) and I will continue to read them until I can dream every scenario and every variable on entry. Have a good weekend!
 
1
  • Post #6,086
  • Quote
  • Jul 16, 2016 6:08pm Jul 16, 2016 6:08pm
  •  Jens89
  • | Joined Jun 2016 | Status: Member | 85 Posts
Quoting Elflaco
Disliked
I you just look at the 4 horsemen, EMA and ROMAR, then you're right. But the SAR attachment was a signal for the market heading in the opposite direction and the MACD arrow up indicated the same. That is why dove_alliance always talks about the big picture, you have to see everything that is happening in the moment, not just a part of it. What helps to determine wheter it's a good entry or not for me is by only enter on a new opening H2 candle, and therefore also a new opening H1 candle. The indicators move at that point and give a solid indication...
Ignored
I was expecting the comment about the SAR
I also take screenshots when I take trades.

as you can see below, the sar was actually on the way up at the moment of entry. I also try to open a trade as close as possible to the 2 hours.
when I trade I indeed do exactly that, keep on reading everything over and over again. I have done it multiple times and I will still need to do it more times till everything comes together.
I am trying to post my trades here for other people to discuss and learn. Dove isn't here anymore but we can still discuss together.

edit: I guess the DB was attached and going for the down but it could still bump higher too though.

Attached Image (click to enlarge)
Click to Enlarge

Name: EURUSD 2 hour.PNG
Size: 64 KB
 
 
  • Post #6,087
  • Quote
  • Jul 18, 2016 11:52am Jul 18, 2016 11:52am
  •  Jens89
  • | Joined Jun 2016 | Status: Member | 85 Posts
my Long trade on USDJPY today,

got scary for a moment there as when price came down to the parabolic I was maybe 2-3 pips away from being stopped out.

Attached Image (click to enlarge)
Click to Enlarge

Name: usdjpy 1 hour.PNG
Size: 26 KB


Attached Image (click to enlarge)
Click to Enlarge

Name: usdjpy 2 hour.PNG
Size: 41 KB


reasons for entry:

2 hour: price opened above all horsemen with purple crossing above ROMAR for the long. the parabolic flipped to support and the DB / SAR was moving for the uptrend.
1 hour: all horsemen moving up and the same scenario with the DB / SAR.

easy entry looking back to it but it was painful to see myself almost being stopped out
 
 
  • Post #6,088
  • Quote
  • Edited 9:37am Jul 19, 2016 8:33am | Edited 9:37am
  •  Jens89
  • | Joined Jun 2016 | Status: Member | 85 Posts
Trade for today Long USDCHF

Attached Image (click to enlarge)
Click to Enlarge

Name: USD CHF 1 hour.PNG
Size: 25 KB


Attached Image


reasoning:

2 hour: at point of entry the parabolic flipped so not attached in stone yet. I normally would not enter but purple crossed above EMA for the long aswell + SAR also going in for the long so I found it to be a good probability.

1 hour: all fine. horsemen, ema, ROMAR all ready for the long.

I got out my position because of the housing permits.

which news do you guys avoid? I know dove mentioned he gets out before : interest rate decisions and NFP.
although some other news can also be painful if the result is far off from the expected.

edit: in hindsight it seemed better to enter when the parabolics was set in stone but I'm not sure about that cause it still seemed a good probability to me. any ideas?
also, during my entry when the candle dropped near the bollinger band, it skewed the EMA and purple so it didn't look like it crossed anymore. so if it would have closed down and negated the cross I would have gotten out. just something to think about.
 
 
  • Post #6,089
  • Quote
  • Edited 2:17pm Jul 21, 2016 12:33pm | Edited 2:17pm
  •  Jaymantos
  • Joined Mar 2016 | Status: - | 391 Posts
The moment.

EUR/JPY is in a consolidated retrace to Daily EMA/Support from Daily ROMAR/Resistance at 118,4.

Heavy Support at 116,133 because of last swing low and Daily EMA/Support power zone.

Now; 1H EMA is sliding over ROMAR. with a few pips range before ROMAR actually becomes a Resistance. So the 1H is cosolidating the downtrend. Along with the 2H which is in the process of turning its ROMAR into Resistance too with an open below it and Purple locked at it.

4H is consolidating also turning down with Smooth/Purple down and PSAR flip. Purple/EMA has not happen.

Market is in the middle of the consolidated retrace and needs to hit a good resistance zone before I take a SELL. The 2H has not created that Resistance but is in the process with the 1H leading. I would trade that down move based upon the 2H.

scenario 1) The new resistance area holds and I take a sell from it.

scenario 2) it does not hold and I take a BUY from Support, from the 1H ROMAR.

both scenarios are for 40/40
No tree, it is said, can grow to heaven unless its roots reach down to hell
 
 
  • Post #6,090
  • Quote
  • Jul 21, 2016 12:37pm Jul 21, 2016 12:37pm
  •  Jaymantos
  • Joined Mar 2016 | Status: - | 391 Posts
Quoting Jaymantos
Disliked
The moment. EUR/JPY is in a consolidated retrace to Daily EMA/Support from Daily ROMAR/Resistance at 118,4. Heavy Support at 116,133 because of last swing low and Daily EMA/Support power zone. Now; 1H EMA is sliding over ROMAR. with a few pips range before ROMAR actually becomes a Resistance. So the 1H is cosolidating the downtrend. Along with the 2H which is in the process of turning its ROMAR into Resistance too with an open below it and Purple locked at it. 4H is consolidating also turning down with Smooth/Purple down and PSAR flip. Purple/EMA...
Ignored
Also; if the last level is tested again without the indicators aligned and giving confluance, thus not allowing me to catch it, I will BUY straight from Daily EMA.
No tree, it is said, can grow to heaven unless its roots reach down to hell
 
 
  • Post #6,091
  • Quote
  • Jul 21, 2016 12:57pm Jul 21, 2016 12:57pm
  •  Jaymantos
  • Joined Mar 2016 | Status: - | 391 Posts
I am talking for myself here : With this system we take 40 pips and we run away from trading for the day.

We can study, we can watch the market move for exercising our wisdom. But we can no more take any trade for the day. This is how we eliminate greed - the reason for failure.

Blessings
No tree, it is said, can grow to heaven unless its roots reach down to hell
 
 
  • Post #6,092
  • Quote
  • Jul 21, 2016 1:32pm Jul 21, 2016 1:32pm
  •  marian
  • | Joined Nov 2010 | Status: Member | 196 Posts
But if the rules of a system are solid, there should be no problem to take more than 40 pips? What will you do if your first trade is a loss? Will you run away for the day or try again?

Nice to see that you are still using this system, Jaymantos. I started to study the thread in March but then I got distracted.
 
 
  • Post #6,093
  • Quote
  • Jul 21, 2016 2:12pm Jul 21, 2016 2:12pm
  •  Jaymantos
  • Joined Mar 2016 | Status: - | 391 Posts
Quoting marian
Disliked
But if the rules of a system are solid, there should be no problem to take more than 40 pips? What will you do if your first trade is a loss? Will you run away for the day or try again? Nice to see that you are still using this system, Jaymantos. I started to study the thread in March but then I got distracted.
Ignored

Hello marian.

It is because, the rules with this system are for intraday trading as mentioned by Dana.

The goal with this system is consistent profits. Each and every trade is for 40TP/40SL pips. This is part of the rules with this system, which indeed contributes to make it a solid system.

In my opinion ;

For one : It eliminates greed completly.

For two : an intraday move is not infinite. We don't control the market. It is best to select a small finite amount of pips at odds with us and to let the rest of the market go to hell!
No tree, it is said, can grow to heaven unless its roots reach down to hell
 
 
  • Post #6,094
  • Quote
  • Edited 4:39pm Jul 23, 2016 2:47pm | Edited 4:39pm
  •  Jens89
  • | Joined Jun 2016 | Status: Member | 85 Posts
Quoting Jaymantos
Disliked
{quote} Hello marian. It is because, the rules with this system are for intraday trading as mentioned by Dana. The goal with this system is consistent profits. Each and every trade is for 40TP/40SL pips. This is part of the rules with this system, which indeed contributes to make it a solid system. In my opinion ; For one : It eliminates greed completly. For two : an intraday move is not infinite. We don't control the market. It is best to select a small finite amount of pips at odds with us and to let the rest of the market go to hell!
Ignored
I completely agree. what's more important, try to squeeze the maximum out of every trade or to be consistent making 40 pips most days?
some moves will be barely over 40 pips, some moves will be 100 pips or more. I don't care, I care about the good entries and consistent results.
take into account that no one knows anything about how the system is computed so following the author is your safest bet here.

besides, you can also swingtrade as stated in the thread where you can make more than 40 pips.
 
 
  • Post #6,095
  • Quote
  • Jul 25, 2016 2:00pm Jul 25, 2016 2:00pm
  •  Jaymantos
  • Joined Mar 2016 | Status: - | 391 Posts
There was a perfect SELL 20/40 at 116,55 on the 12:00 Bar (at 13:30). 2-3 mins after the JPY news. It was with a hit of Resistance (because of the news announcing double spending for stimlulus) and the pair being fully downtrend still.

edit: the entry lasted 5 mins before T/P.

I selected only 20 pips because of Daily EMA/Support and 4H ROMAR/Support restraining the access.
No tree, it is said, can grow to heaven unless its roots reach down to hell
 
 
  • Post #6,096
  • Quote
  • Jul 26, 2016 1:06pm Jul 26, 2016 1:06pm
  •  Jaymantos
  • Joined Mar 2016 | Status: - | 391 Posts
No tree, it is said, can grow to heaven unless its roots reach down to hell
 
 
  • Post #6,097
  • Quote
  • Edited 5:50pm Jul 28, 2016 5:23pm | Edited 5:50pm
  •  Jens89
  • | Joined Jun 2016 | Status: Member | 85 Posts
I have been checking my charts a bit and on the screenshot below I've noticed what I would call a perfect entry.

I have circled where I would have entered on the 2 and 1 hour. on the 2 hour you can see we have everything as resistance, ROMAR, EMA, horsemen and the parabolic just flipped for resistance aswell. on the 1 hour you can see at the point of entry that also everything there was resistance.

I haven't included the daily but also on the daily everything was trending down and at the point of entry it was at white resistance.
So everything looked perfect for a short. but it never went lower than what you can see in the screenshot it only went up from there.

the point of entry would have been the 26th of July at 6pm GMT, EURUSD. Is there anything I'm overlooking here or could I just classify it as bad luck?


Attached Image (click to enlarge)
Click to Enlarge

Name: EURUSD trade.PNG
Size: 27 KB
 
 
  • Post #6,098
  • Quote
  • Jul 29, 2016 5:22am Jul 29, 2016 5:22am
  •  Pandakker
  • | Joined Feb 2011 | Status: Learning | 110 Posts
Quoting Jens89
Disliked
I have been checking my charts a bit and on the screenshot below I've noticed what I would call a perfect entry. I have circled where I would have entered on the 2 and 1 hour. on the 2 hour you can see we have everything as resistance, ROMAR, EMA, horsemen and the parabolic just flipped for resistance aswell. on the 1 hour you can see at the point of entry that also everything there was resistance. I haven't included the daily but also on the daily everything was trending down and at the point of entry it was at white resistance. So everything looked...
Ignored
Hi,To me, on the 2Hr Ema was still support, as it did not cross purple at the circled bar. That happened later. Also I cannot see on the 2Hr chart if ema crosses smooth for full downtrend. So I think 2Hr is in consolidation. You also have the SAR at bottom. In consolidation next SAR connection will be at a top, which I do not see on your chart. So for me this situation was not an entry to go short.
 
 
  • Post #6,099
  • Quote
  • Aug 1, 2016 1:38pm Aug 1, 2016 1:38pm
  •  Jens89
  • | Joined Jun 2016 | Status: Member | 85 Posts
Quoting Pandakker
Disliked
{quote} Hi,To me, on the 2Hr Ema was still support, as it did not cross purple at the circled bar. That happened later. Also I cannot see on the 2Hr chart if ema crosses smooth for full downtrend. So I think 2Hr is in consolidation. You also have the SAR at bottom. In consolidation next SAR connection will be at a top, which I do not see on your chart. So for me this situation was not an entry to go short.
Ignored
thanks for your reply

you are right, normally I wouldn't enter at that stage but because of the PSAR flip it means I would already enter, let's say it wasn't set in stone yet I would have entered at the candle after so we have the confirmation in stone and then EMA is resistance. I also know about the SAR indeed, but I am still not very skilled in SAR/DB when they are set in stone and not. also, ignoring the SAR and DB and looking at everything else it screams a short in my view, horsemen, parabolic, ROMAR, EMA.

If I understand correctly, would your main reason not to short be due to the SAR looking to go up?
 
 
  • Post #6,100
  • Quote
  • Aug 1, 2016 10:12pm Aug 1, 2016 10:12pm
  •  Jaymantos
  • Joined Mar 2016 | Status: - | 391 Posts
To me, since the Brexit referendum on 24th of june, the market is twirling around and very hard to catch for a beginner (like myself). I had way less trouble entering the market during spring. Hopefully things will smoothen a bit soon.
No tree, it is said, can grow to heaven unless its roots reach down to hell
 
 
  • Trading Systems
  • /
  • The Paradox System
  • Reply to Thread
    • 1 303304Page 305306307 863
    • 1 Page 305 863
0 traders viewing now
  • More
Top of Page
  • Facebook
  • Twitter
About FF
  • Mission
  • Products
  • User Guide
  • Media Kit
  • Blog
  • Contact
FF Products
  • Forums
  • Trades
  • Calendar
  • News
  • Market
  • Brokers
  • Trade Explorer
FF Website
  • Homepage
  • Search
  • Members
  • Report a Bug
Follow FF
  • Facebook
  • Twitter

FF Sister Sites:

  • Metals Mine
  • Energy EXCH
  • Crypto Craft

Forex Factory® is a brand of Fair Economy, Inc.

Terms of Service / ©2023