Interesting thread. I use price action in determining my trades. I have been on the PIE thread a bit, but it seems to be geared more towards Seiden's
trading method. Nothing wrong with that, I just approach it a bit differently. As a US trader, I am restricted to FIFO so I cannot "position" trades
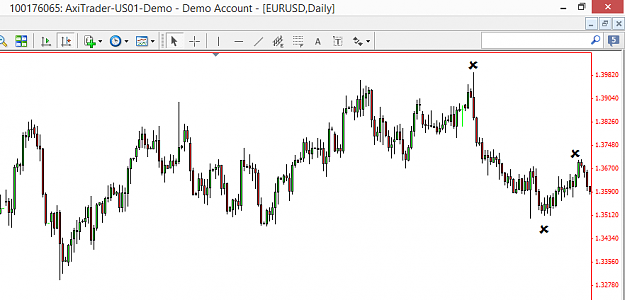
(ie hedge) unless I wanted to open separate accounts, (kind of a hassle but it works.) At any rate, I mainly trade USDJPY and EURUSD pairs, with the
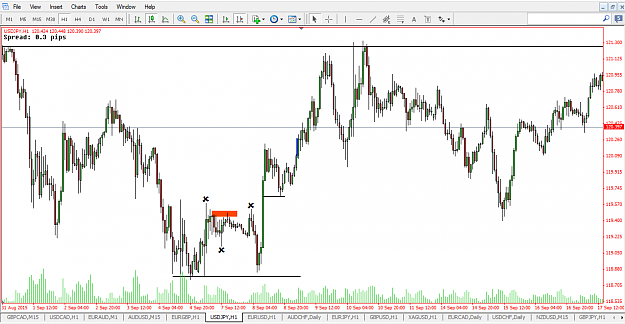
occasional aussie or pound trade thrown in. I find these two the most liquid. As far as entry and exits for trades I often set up my charts
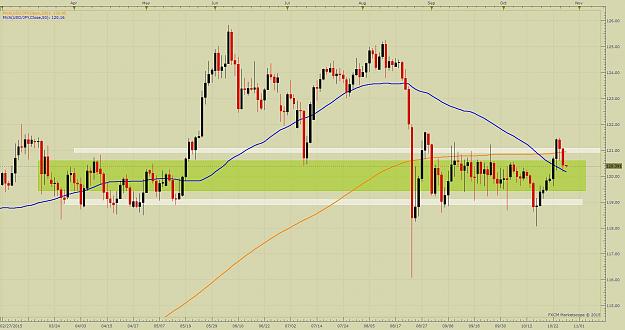
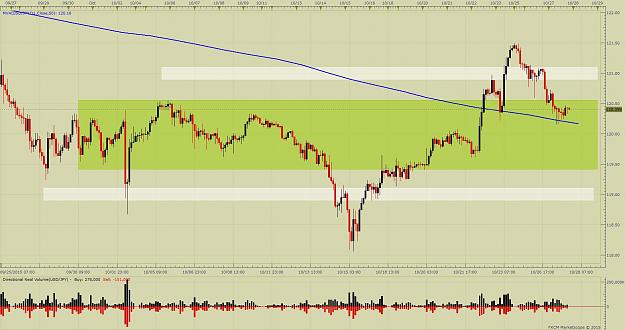
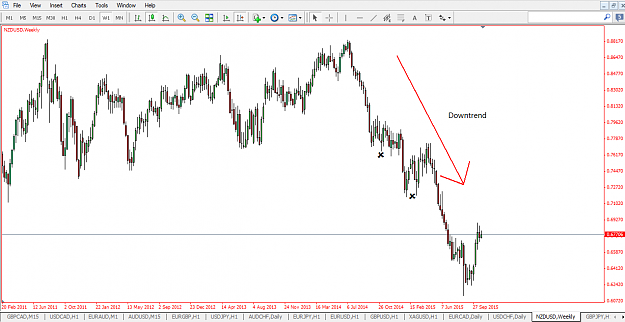
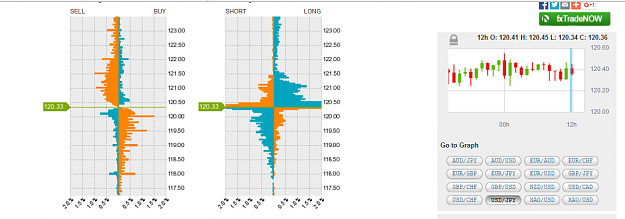
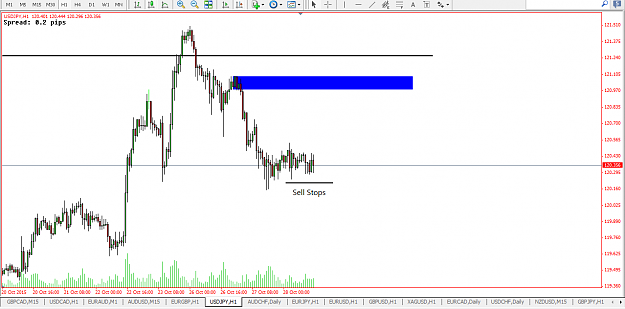
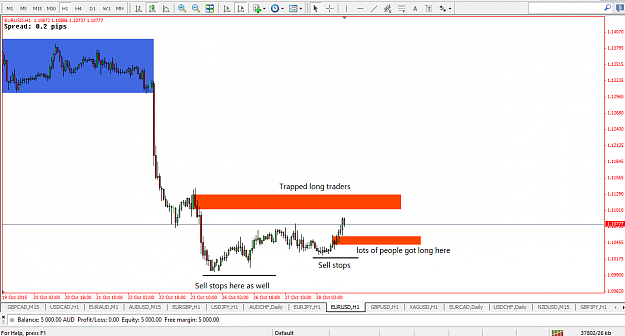
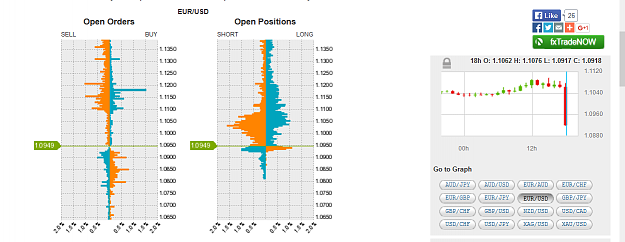
(daily through 2hr) like the ones below. Since we are trading against someone/thing I look to where larger trade levels seem to occur, often whole numbers
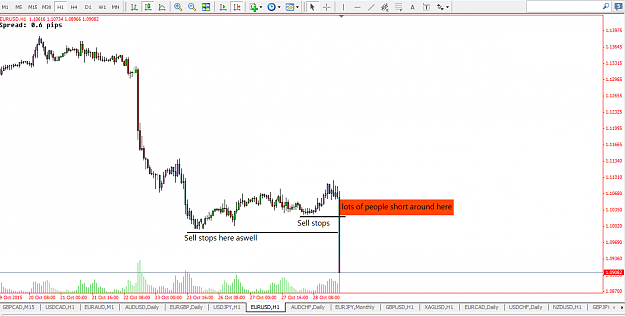
but not a hard and fast rule. Just above or below seem to be areas where so called support or resistance take place. I believe it is the market makers
taking out the smaller traders be they retail or large positions taking out smaller M's. Once the supply is exhausted, the white areas on the charts then
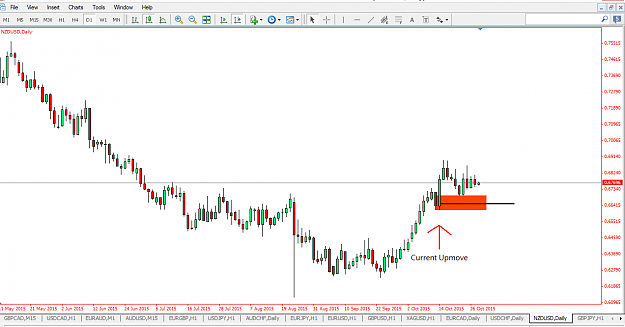
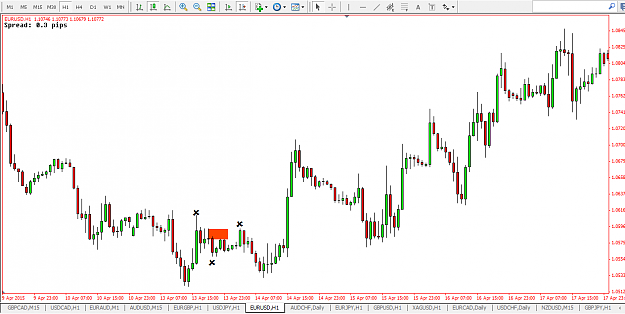
seem to become distribution areas (price either moving above or below depending on trend and market conditions). My current favorite setup is when a 50sma(daily)
moves in one of these areas and price is also at the same location, or looking to approach this area following the trend. There is more but I have to get ready for game one world series. Check in with you later.
good luck to all,
regards
goma
trading method. Nothing wrong with that, I just approach it a bit differently. As a US trader, I am restricted to FIFO so I cannot "position" trades
(ie hedge) unless I wanted to open separate accounts, (kind of a hassle but it works.) At any rate, I mainly trade USDJPY and EURUSD pairs, with the
occasional aussie or pound trade thrown in. I find these two the most liquid. As far as entry and exits for trades I often set up my charts
(daily through 2hr) like the ones below. Since we are trading against someone/thing I look to where larger trade levels seem to occur, often whole numbers
but not a hard and fast rule. Just above or below seem to be areas where so called support or resistance take place. I believe it is the market makers
taking out the smaller traders be they retail or large positions taking out smaller M's. Once the supply is exhausted, the white areas on the charts then
seem to become distribution areas (price either moving above or below depending on trend and market conditions). My current favorite setup is when a 50sma(daily)
moves in one of these areas and price is also at the same location, or looking to approach this area following the trend. There is more but I have to get ready for game one world series. Check in with you later.
good luck to all,
regards
goma
Attached Image(s) (click to enlarge)