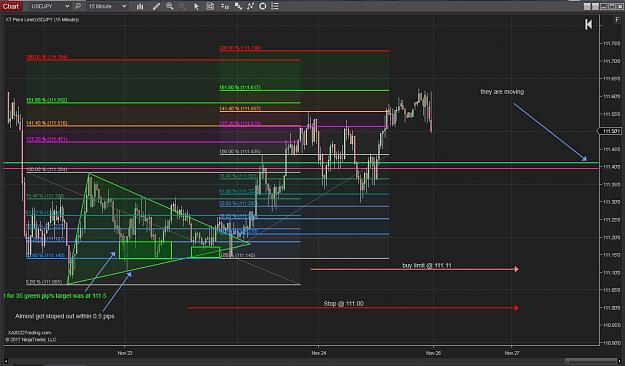
If you are tracking USDJPY this week, you may consider this top-down technical perspective.
On the daily time frame, price action is strongly under the control of bears. On Friday, the bulls attempted to push price up but were restrained by bears. Should bulls manage a follow-through early this week, we may see a retracement upward, with a likely target being the immediate resistance around the 112.680 area, and may extend to test an inner resistance trendline (navy colour).
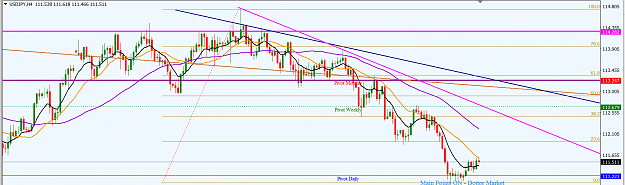
On the H4 time frame, price action is operating in an area of consolidation but the last session saw the formation of an indecision candlestick which failed to take out the high of the previous candlestick. It was apparent from the number and size of the bullish candlesticks that the bulls were more influential. We may see a retracement to the upside before a southward continuation materializes. Such a retracement may extend to validate the inner resistance trendline (magenta colour) on the H4 time frame, perhaps at an area of confluence to the 38.2 Fib retracement of the swing down from the high of November 6, 2017. This area is around the 112.680 handle.
I may be wrong. Trade safe and prosper.
KP
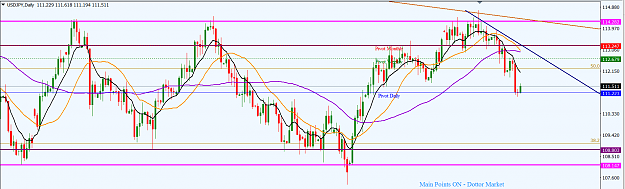
On the daily time frame, price action is strongly under the control of bears. On Friday, the bulls attempted to push price up but were restrained by bears. Should bulls manage a follow-through early this week, we may see a retracement upward, with a likely target being the immediate resistance around the 112.680 area, and may extend to test an inner resistance trendline (navy colour).
On the H4 time frame, price action is operating in an area of consolidation but the last session saw the formation of an indecision candlestick which failed to take out the high of the previous candlestick. It was apparent from the number and size of the bullish candlesticks that the bulls were more influential. We may see a retracement to the upside before a southward continuation materializes. Such a retracement may extend to validate the inner resistance trendline (magenta colour) on the H4 time frame, perhaps at an area of confluence to the 38.2 Fib retracement of the swing down from the high of November 6, 2017. This area is around the 112.680 handle.
I may be wrong. Trade safe and prosper.
KP
Attached Image (click to enlarge)
Attached Image (click to enlarge)
Do your homework, follow the footprints of smart money