resistance, ichimoku, MA, or whatever.... everything looks fake to me these days.
Ignored
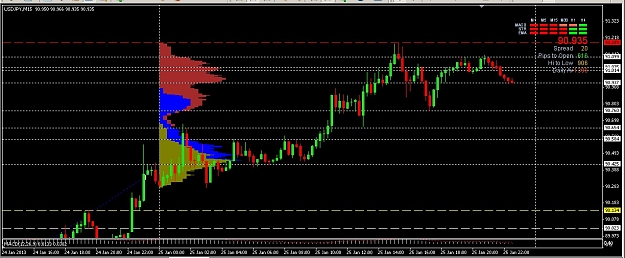
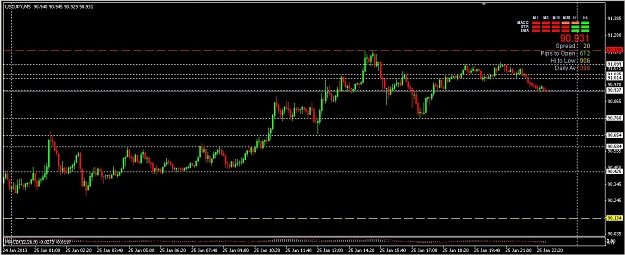
How I Trade USDJPY with SR. SR I paint under Market Profile 15 min TF, but I trade it in 5 min. TF chart+ MACD. Its' all.
I am not Forex scientist I believe in investors who buy for selling and sell for buying. All for money.
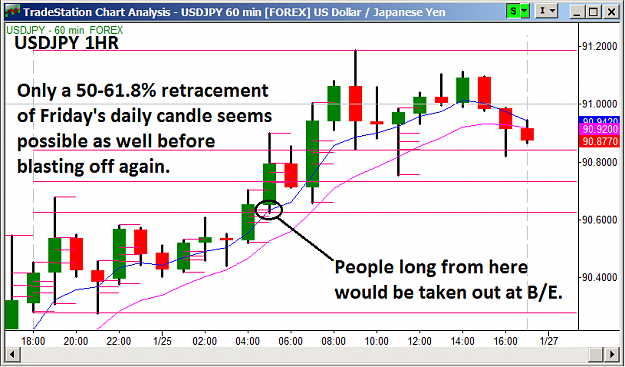
Price lies all the time, that's the whole point. An institution will paint a bearish daily engulfing candle, consolidate to build contracts 'with the trend' then slam it the other way hard and fast.
If 'price never lies', it would be too easy.
Let's look at the last 3 weeks of daily USDJPY price action....
when I am thinking - I lose. Widescreen have you seriously rational argument for your opinion ?
I have it simply. I am chartist.
Ignored
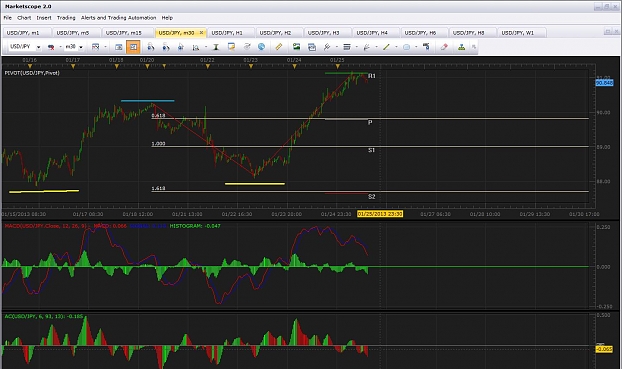
im seeing negative deliverance on the with the macd on the 30m chart also hit r1 on the pivot. it also has been losing momentum. that leads me to think there will be some pull back to around .61 on the fib at least.
im thinking about going for short @ 90.94 now..... target aimed for 89.75 to 89.1 ..... what do you guys think ?
Ignored
i sawe a 82 painted at close u may see a drop sun if my intuition correct but these days even that is faulty over trading im holding short for 8980 or lower good luck
perma bulls we will see !i wish i was not a contrarian but im getting hammered waiting for sunday i believe by tues we see 8980 though perhaps thursday imho.
Price lies all the time, that's the whole point. An institution will paint a bearish daily engulfing candle, consolidate to build contracts 'with the trend' then slam it the other way hard and fast.
If 'price never lies', it would be too easy.
Let's look at the last 3 weeks of daily USDJPY price action....
USDJPY Daily
Three consecutive bear traps (red circles); these are valid 3-candle reversal signals, yet thursday and friday, price slammed north.
So may i ask: do you really think 'price...
Ignored
You don't play price action in the middle of nowhere, only at key levels. If you're looking to sell in a bull market like this you should already know it's a higher risk anyway. Great trend entries in some of these as well. Let me tell you what I see. Circle one we have a bullish engulfing bar at the swing low. Since it doesn't lay on any previously obvious demand I probably would have avoided, but it worked out anyway. After it breaks the high of circle one, price drops and re-tests the previous high as a demand zone. No big price action patterns for me to enter on, but it's very clear we have a new demand zone at this low as it takes off. Price re-visits again after making a higher high and forms a pinbar right at our demand level in circle three. Bingo - enter long and join the trend. Price may not always tell the truth, but it definitely provides a good edge.
DaEdge is a good guy, and despite his low vouch number he knows what he's talking about.
You don't play price action in the middle of nowhere, only at key levels. If you're looking to sell in a bull market like this you should already know it's a higher risk anyway. Great trend entries in some of these as well. Let me tell you what I see. Circle one we have a bullish engulfing bar at the swing low. Since it doesn't lay on any previously obvious demand I probably would have avoided, but it worked out anyway. After it breaks the high of circle one, price drops and re-tests the previous high as a demand zone. No big price action patterns...
Price lies all the time, that's the whole point. An institution will paint a bearish daily engulfing candle, consolidate to build contracts 'with the trend' then slam it the other way hard and fast.
If 'price never lies', it would be too easy.
Let's look at the last 3 weeks of daily USDJPY price action....
Yes but my point for FiatFap was that price action is useless without location, location, location. You can't just say "on look an outside bar!" when it happens in the middle of nowhere and counter the recent trend direction.
Yes but my point for FiatFap was that price action is useless without location, location, location. You can't just say "on look an outside bar!" when it happens in the middle of nowhere and counter the recent trend direction.
Ignored
You make a great point about location, but isn't that the subjectivity of trading: which level, on which timeframe and on what pair? It's not in the 'middle of nowhere' if you look at the bigger picture.
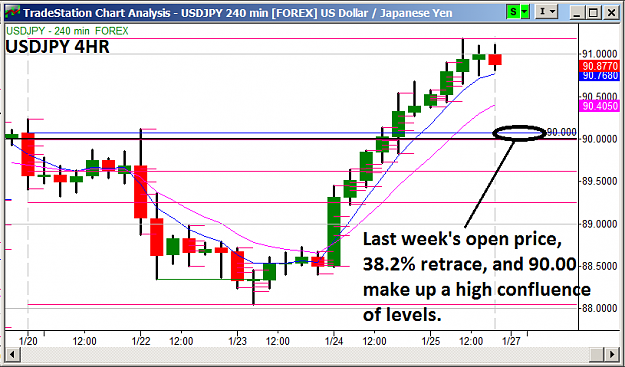
Again from here, let's time travel back to ~Jan 2010 to see the macro sentiment on the monthly. I've pasted the daily triple sell trap we're discussing to the right. Buyers would have loaded up on each fib level from that strong bullish candle at the yellow arrow and a double bottom (red box), but price tanked from may 2010 for 10 months through these fib buy zones.
Today, price tested the last chance level @ 61.8%, so we now get to see who values their debasing more - americans or the japanese. The race to the bottom is the name of the game and the GBP is now joining that race with Carney taking over as BoE governor.
I expect consolidation going into next week to build more sell contracts before the BoJ does a final push north to ~95, setting a strong tone of intent.
One more thing, the true trend is always the slower trend and this BoJ wreaks of desperation. Looking at the monthly, you can see the trend is clearly down and price has now come back to a previous buy trap zone from 2009. The momentum to get there is suspicious. America has HUGE deficits, so it's in their interest to devalue the dollar more than most. When...is the all important question.
USDJPY - Monthly levels versus Daily reversal signals
You make a great point about location, but isn't that the subjectivity of trading: which level, on which timeframe and on what pair? It's not in the 'middle of nowhere' if you look at the bigger picture.
Again from here, let's time travel back to ~Jan 2010 to see the macro sentiment on the monthly. I've pasted the daily triple sell trap we're discussing to the right. Buyers would have loaded up on each fib level from that strong bullish candle at the...
Ignored
Hey FiatFap,
I appreciate your response. Absolutely, trading is very subjective, but there are a few items I want to point out. When I discuss supply and demand, I'm not talking about fib or other indicator-based levels like floor pivots, which is why I use this as opposed to "support" and "resistance". Supply and demand levels are strictly horizontal levels where price has shown difficulty getting through in the past because supply was greater than demand or vice versa. Often times these levels render themselves apparent because the strongest levels tend to have quick rejections of price as buy or sell orders are triggered by institutional players, generating long wicks at each interaction until the level wears down and eventually the last of the orders are consumed and price has no choice but to move.
When I approach a chart I tend to only mark up one time frame of levels, for example the hourly. I use the daily trend as a bias, if one exists. Since the market is very much fractal, if you try to apply levels from a higher time frame to a lower one, you're going to have very large zones transplating them onto your smaller time frame chart which may conflict with the ones you're marked up on the lower one. As a result I've found it best to play the levels as I see price reacting to them on the time frame the levels were created on. So I wouldn't typically be trying to apply a 1 hour reversal pattern to a daily chart. The same goes with trends - why would you apply a monthly chart to determine the daily trend? I go one level up to determine trend bias but more than that and if the trend isn't obvious there's no point in having a bias because higher and it really applies to your day chart as much as the hourly trend does.
Yes but my point for FiatFap was that price action is useless without location, location, location. You can't just say "on look an outside bar!" when it happens in the middle of nowhere and counter the recent trend direction.
Ignored
alright but yen where it is right now is ridiculous
New voice message: Why are you calling me? If I need you, I'll call you!
why would you apply a monthly chart to determine the daily trend?
I view timeframes as a zoom function, so starting from the monthly we see price from atop a mountain, zooming in on price then puts us in the muddy field of base-camp (1min).
As a contrarian, the USDJPY is a prime candidate for selling as it's come back into a previous buy rejection area from 2009 fib zone(s). But it's best to wait for price to come back to those three daily bearish candles i pointed out.
If i was the BoJ, i'd be gapping down price over the weekend back into these bearish daily levels, set a holding pattern, spike it down further into next week, then slam it up for a final drive north.
Edit: this puts the BoJ into context, below shows momentum from the last 3 months. All black lines are yen pairs and red thick line is USDJPY. EURJPY has exploited this QE intervention the most with a 22% move.
Maybe, but that's what stop losses are for. In any case that post didn't have much to do with my position on the yen, so much as it did general trading with regards to supply and demand zones. My personal opinion on the yen, which means about zilch in the grand scheme of things, is that it has lots of room upwards with the public manipulation the BOJ has been doing. I recently heard some official say that "100 would be acceptable". As long as you play it safe as usual there shouldn't be any problem just playing the levels as they show themselves and trailing a stop.