OK, here is how I use the Ichimoku Kinko Hyo. As I mentioned on another post without the image, most traders overlook the simple fact that a Forex pair is a mathametical Ratio which basically means both sides are equal. In this case "equals" also means 50% or half. This basically means there is always a 50% point in any movement. Thie 50% is actually everywhere including in the Opening & Closing price of every candle bar.
**You can actually check this with any bar when it moves & you will notice that the price 'usually' goes both ways on each bar. The best way to check this would be to insert a 1 period Moving Average (set at Shift 1, Simple, Median) Also insert a 1 period Moving Average (set at Shift 1, Simple, Close) which moves at the same rate & speed as the price. This MA should typiaclly cross the 1 period Moving Average (set at Shift 1, Simple, Median) AND, this1 period Moving Average (set at Shift 1, Simple, Median) will always be right in the middle of both the 1 period Moving Average (set at Shift 1, Simple, Close) & (insert) a 1 period Moving Average (set at Shift 1, Simple, Open).
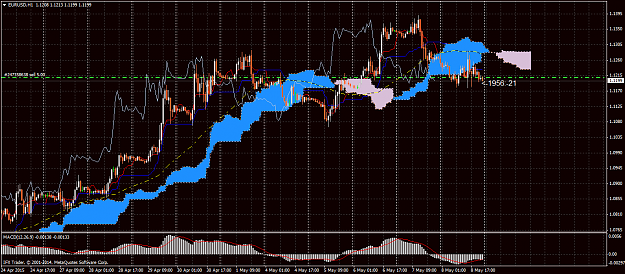
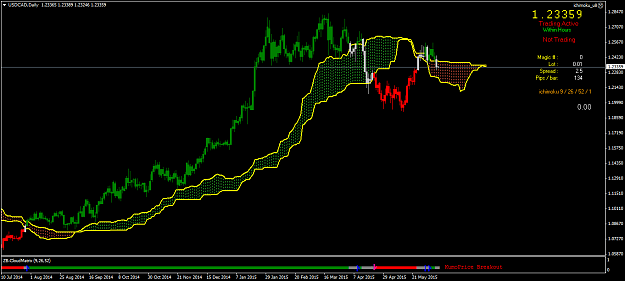
PLEASE NOTE THAT I HAVE NOT PUT ALL THE MOVING AVERAGES IN MY ATTACHED IMAGE AS IM USING BOLLIGER BANDS IN THE ATTACHED EXAMPLE.
The Ichimoku is an extention of the 50% crossing which is evident whenever the Trend swithes sides. I have deliiberately avoided saying how exactly to use this Ichimoku setting & neither am I going to reveal the actual settings. If you want to understand how this works, try & do some homework. Im out.
|
Joined Dec 2023
|
Status: Junior Member
|3 Posts
Surprised a ichimoku thread has only 15 pages .
Ill explain how i trade the ichimoku .
The indicators i use :
~Traders dynamic index (TDI)
~Ichimoku cloud
~15 ma (mine is green)
~50 ma (mine is red)
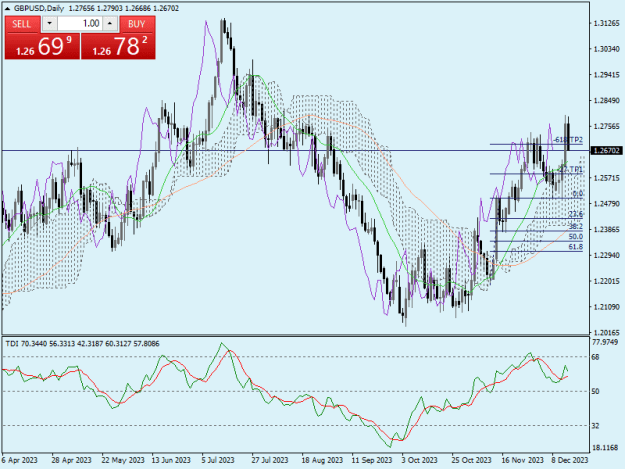
I use weekly / daily / hour 4 , timeframes for analysis.
on the weekly i am only looking at the last 12 candles ( 3 months ) , i am looking to see if price is near or at key areas - support - resistance .
I will also be looking to see if it is in a uptrend or downtrend .
I do the same on the daily , however , on te daily i will mark the chart for trends , fibbonacci , S&P , key areas.
i will also , if possible use fibonacci retracement on the daily and h4 timeframe .
IMPORTANT
I have 2 levels added on the fibonacci for take profits .
~0.27 description: -27 TP1
~0.618 description: -618 TP2
I have used these for years and they perfectly for me , you can adjust to your liking , but i find these are the best . its optional.
If i have placed fibonacci retraceent on the daily , i will be watching h4 for a entry from fibo levels - 38.2 , 50 , 61.8 . i will wait for a closed reversal candle and enter , or wait for a doji , or any candle pattern that signals a price reversal . in my opinion , i find it bettter and more reliable to wait for a second reversal candle open, if price does not reverse at any of these levels . i will not trade the fibo with this trade. .
When using TDI for entries , enter on the 1st , 2nd , or 3rd candle . if its more than 3 candles do not enter.
once i have checked all of this , i will be looking for my entries , witch are :
BUY
~price above cloud
~chikou span above price
~15 ma above 50
~TDI green above red
SELL
~price below cloud
~chikou span below price
~15 ma below 50
~TDI green below red
IMPORTANT
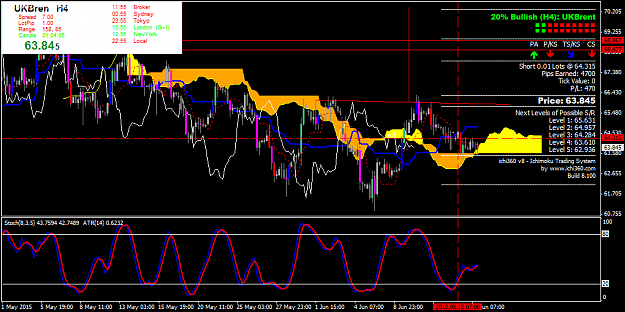
Stop loss i place below or above previous high , or , depending on the chart , below or above 50ma .
orange box = entry
red box = stop loss
green box = Take profit
if no green box , im using fibo levels take profits.
vertical red line is so you ccan see tdi line.
ill provide examples below . any questions quote this please.
This is the d1 analysis , and h4 entry using fibo on daily.
when my account is allowed , i will create a trading system with this and be more in depth.
Attached Image(s) (click to enlarge)
If you are not losing , you are no trying hard enough.