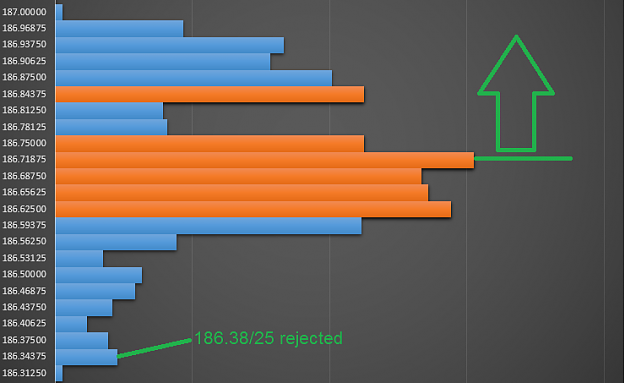
Disliked{quote} Ray... Most recently ive been using the numbers from week 36 as my reference points. They seem to hold up nicely. Prior to you coming back recently I had been using a set from week 15. Although they are similar, they do differ slightly and yet both sets have many of the same DP Zones as I like to refer to them as. Anyways, I was wondering what variable in your math causes a change in these DPs? For instance, you have 186.88/75 and 186.38/25 as a current zones and the numbers i am using are 186.60/40. Now when I placed my buy and sl on friday...Ignored
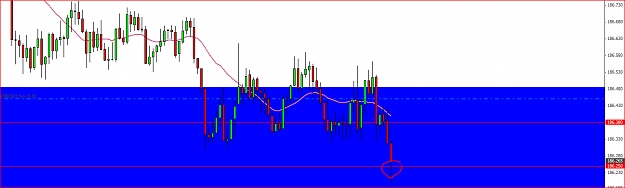
The variables in math causes the change in these DPs are range-expansion, volatility and price.
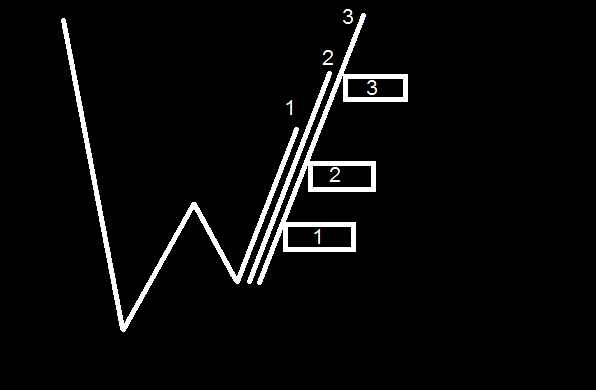
Lets assume we have a uptrend and a range expansion the the upside. Now as soon as the new high is printed, support is following depending on where the high is made. Orderflow-wise it means traders chasing their bid up depending on that high. If you check the pic you may have a good illustration.
Hope that helps.
Attached Image