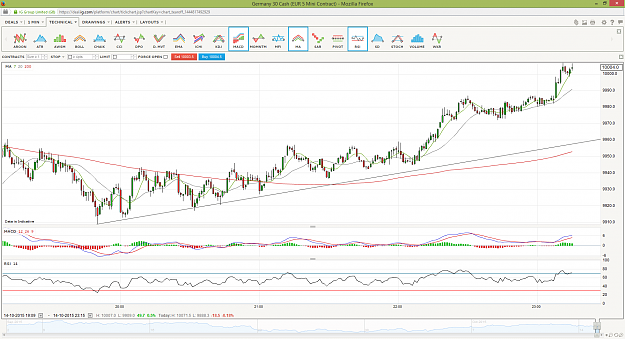
Disliked1H chart, sitting on 200sma, but has failed to break 7sma on the upside. I can see this going to at least 50% Fib - 9747 by 20-21 Oct. You can see the broken up trend-line from 12 Oct. Also, the bottom of the long term down trend channel appears in bottom left corner just below 9500, this could also be a target by 20-21 Oct. If we break this channel again, then likely new lows. {image}Ignored
IF price follows that down channel on my 15m chart that I posted earlier it will reach 9500 next Wednesday.
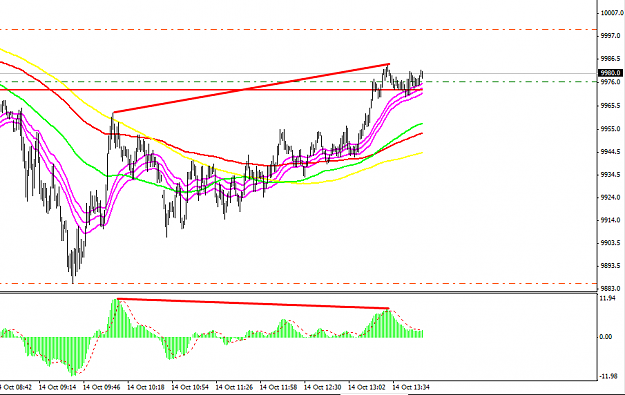
This morning the low was on the bottom of the channel in the S&R zone shown around the .38 fib...
Trading Levels with WRBs