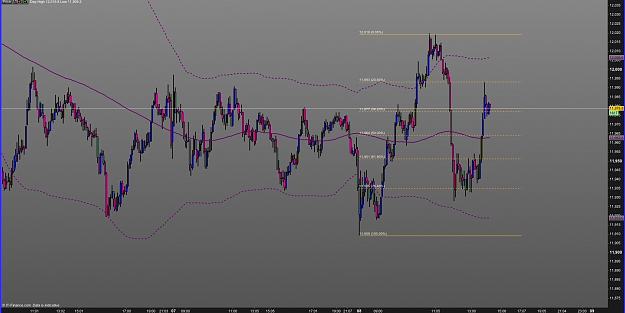
I thought I'd share a chart that I use for session planning. It's a 250 tick chart with a 160 period Bollinger band.
This morning the SMA160 was flat, and the index started south of the lower Bollinger band - so up is a likely direction.
Similarly, after the morning session, the index was above the upper Bollinger band, while the SMA160 still was flat....down is the likely direction.
Then the lunchtime low was the 76.4% retracement of the range from the overnight low to the morning high...so up.
Attached Image (click to enlarge)