• Home
  • Forums
  • Trades
  • News
  • Calendar
  • Market
  • Brokers
  • Login
  • Join
  • User/Email: Password:
  • 4:55pm
Menu
  • Forums
  • Trades
  • News
  • Calendar
  • Market
  • Brokers
  • Login
  • Join
  • 4:55pm
Sister Sites
  • Metals Mine
  • Energy EXCH
  • Crypto Craft

Options

Bookmark Thread

First Page First Unread Last Page Last Post

Print Thread

Similar Threads

Auction Market Theory and Market Profile 22,206 replies

MarketProfile/Volume Profile/Auction Market Theory indi? 17 replies

ECN && STP && Scalping && Hedging - Broker Review - Oct 2009 24 replies

Auction Market Value Analytics Charts & Data 14 replies

Analytics, recommendations - S&P 500, Euro and other 11 replies

  • Trading Discussion
  • /
  • Reply to Thread
  • Subscribe
  • 1,025
Attachments: Auction Market Value Theory & Analytics
Exit Attachments
Tags: Auction Market Value Theory & Analytics
Cancel

Auction Market Value Theory & Analytics

  • Last Post
  •  
  • 1 5960Page 616263 81
  • 1 60Page 6162 81
  •  
  • Post #1,201
  • Quote
  • Jun 20, 2017 4:21am Jun 20, 2017 4:21am
  •  thetail
  • | Joined Oct 2016 | Status: Member | 80 Posts
Quoting dljonesFan
Disliked
{quote} Hey tail, who is "other nick"? greets C
Ignored
I'll send him a private messsage to check if he want to say something or not.
 
 
  • Post #1,202
  • Quote
  • Jun 20, 2017 5:16am Jun 20, 2017 5:16am
  •  mzvega
  • Joined May 2009 | Status: Member | 1,879 Posts
Quoting dljonesFan
Disliked
{quote} Yes, using only dir and act - thats also a way to deal with the problem. But keep the bigger picture in mind (trending,bracketing,...). greetings C {quote} @Tail: That is what I tried to explain and already showed months ago. We must change the math sign IF THERE IS AN DOWNTREND in the longer timeframe. NOT because of the DIR of one day... But my english was not good enough... "As noted by others, the correct procedure would change the sign in accordance with the sign derived from the calculation of the DIR references, so if DIR is...
Ignored
"The ability to recognize Flow, as obtained from the Visual Graphics reference points, gives a trader guidance for "staying with the market". The Flow measurements' utility is in increasing the odds for making a successful trade"


DL you are familiar with the run pause of the "market unit", how I track balances to determine where we are in market unit , same concept……..

Flow is also used to monitor the run pause of the current trajectory. How you use the data depends as you mentioned, on "condition" and where we lay within the market unit. You monitor the flow of the data. Within the context of the larger TF. You can see when there is no directional bias. You can tell by monitoring the data as the directional bias strengthens, weakens, or changes trajectory. Depending on the condition i.e…….in a trending market the trajectory net flow can give you clues if the market is testing for trend end or just a minor pause. In bracketing markets it can give you clues if the market is testing for new trend or BO.

It’s a tool used to monitor the flow of the current trajectory, not used to generate daily trading signals
Attached Image (click to enlarge)
Click to Enlarge

Name: example1.JPG
Size: 112 KB
Markets are not efficient, rather they are effective - Jones
 
1
  • Post #1,203
  • Quote
  • Jun 20, 2017 5:48am Jun 20, 2017 5:48am
  •  dljonesFan
  • | Joined Oct 2015 | Status: Member | 159 Posts
Quoting mzvega
Disliked
{quote} "The ability to recognize Flow, as obtained from the Visual Graphics reference points, gives a trader guidance for "staying with the market". The Flow measurements' utility is in increasing the odds for making a successful trade" DL you are familiar with the run pause of the "market unit", how I track balances to determine where we are in market unit , same concept.. Flow is also used to monitor the run pause of the current trajectory. How you use the data depends as you mentioned, on "condition" and where we lay within the market unit....
Ignored
Thank you Mzvega,

yes, that was my intention. The overall condition is so important. And what do you think about the calculation? I know its better to know the refs and what they mean. Thats what I think too. And the net flow sum is just one idea to follow the flow, but do you think the calculation is correct? Iam not using the net sum because of that problem, are you using it?

thank you for sharing your opinion
c
 
 
  • Post #1,204
  • Quote
  • Edited 7:26am Jun 20, 2017 6:01am | Edited 7:26am
  •  mzvega
  • Joined May 2009 | Status: Member | 1,879 Posts
Quoting dljonesFan
Disliked
{quote} Thank you Mzvega, yes, that was my intention. The overall condition is so important. And what do you think about the calculation? I know its better to know the refs and what they mean. Thats what I think too. And the net flow sum is just one idea to follow the flow, but do you think the calculation is correct? Iam not using the net sum because of that problem, are you using it? thank you for sharing your opinion c
Ignored
Do I think the calculation is correct? What are you talking about. What makes it incorrect?

1. Why is the rising TFF calculated with +1 in the act table?
If my response to NL didn’t answer your question https://www.forexfactory.com/showthr...32#post9991132 Show me what you mean……..

2. Why is the net flow (act+dir) calculated in that fashion without paying attention to the dir (+/-)?

Why is the net flow (activity + directional references ) calculated in that fashion without paying attention to the directional references (+/-)?

I have no clue as to what you are talking about……..Please don't tell me this has something to do with "Big Red & Green Candlesticks"……...
Markets are not efficient, rather they are effective - Jones
 
 
  • Post #1,205
  • Quote
  • Edited 7:39am Jun 20, 2017 7:10am | Edited 7:39am
  •  dljonesFan
  • | Joined Oct 2015 | Status: Member | 159 Posts
Quoting thetail
Disliked
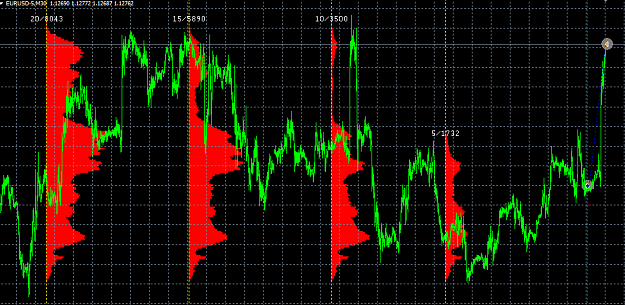
{quote} Yes, in fact sounds strange to me too ... but there is more... the asymmetrical result in calculation. Assume that we use for direction calc these 7 references: Open, High, Low, Close, POC, VA_High, VA_Low and for activity calc these 3 references: VA_Range, TPO_Total, VTY (excluding for the moment the TFF) In a green candle day (ascending market) like the one on EUR/USD pair in the image below, for sure all the dir refs are increasing, so DIR=7 and probably, and anyway we assume that, all the 3 activity refs are increasing, so ACT=3 DIR+ACT=NET...
Ignored
There was a discussion in this thread about that.
From

  1. Post 1,186

Yes its about that chart. The candle sticks are not so important. Its the fact that the net flow sum (not the dir and act) seems to confuse a lot of students. Maybe you can clarify that. I couldnt, because Iam too not shure.

 
1
  • Post #1,206
  • Quote
  • Jun 20, 2017 12:36pm Jun 20, 2017 12:36pm
  •  mzvega
  • Joined May 2009 | Status: Member | 1,879 Posts
Quoting dljonesFan
Disliked
{quote} There was a discussion in this thread about that. From Post 1,186 Yes its about that chart. The candle sticks are not so important. Its the fact that the net flow sum (not the dir and act) seems to confuse a lot of students. Maybe you can clarify that. I couldnt, because Iam too not shure.
Ignored
When did we stop using condition to determine the trend and start using Red & Green day candlesticks to determine the trend?.

If the 3 day rule is the minimum sample of data used for determining if were bracketing or trending when did it become ok to use Red & Green day candlesticks instead??

When did candlesticks become a permitted practice? Or did I miss the memo"

Are they confused because they read somewhere net flow is supposed predict Red & Green day candlesticks, and because it doesn't the calculation is somehow wrong?

I already went down that rabbit hole once……..
https://www.forexfactory.com/showthr...10#post9424010
https://www.forexfactory.com/showthr...74#post9425774
https://www.forexfactory.com/showthr...52#post9428952
https://www.forexfactory.com/showthr...74#post9425774
https://www.forexfactory.com/showthr...52#post9428952

Let's put this in perspective. Months have gone by, right back to where it left off.
I think it best they get their answers directly from Nick
Markets are not efficient, rather they are effective - Jones
 
 
  • Post #1,207
  • Quote
  • Edited Jun 21, 2017 12:15am Jun 20, 2017 5:06pm | Edited Jun 21, 2017 12:15am
  •  thetail
  • | Joined Oct 2016 | Status: Member | 80 Posts
Quoting mzvega
Disliked
{quote} When did we stop using condition to determine the trend and start using Red & Green day candlesticks to determine the trend?. If the 3 day rule is the minimum sample of data used for determining if were bracketing or trending when did it become ok to use Red & Green day candlesticks instead?? When did candlesticks become a permitted practice? Or did I miss the memo" Are they confused because they read somewhere net flow is supposed predict Red & Green day candlesticks, and because it doesn't the calculation is somehow wrong? I already went...
Ignored
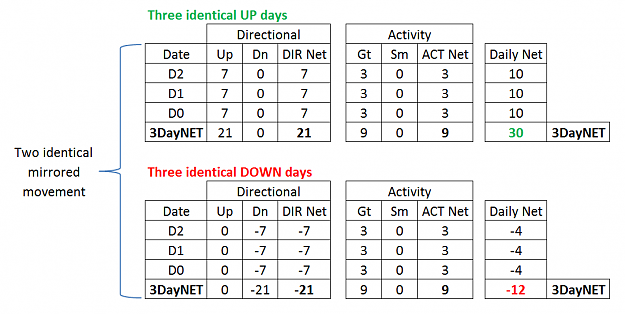
It's really so hard to understand that my post is an example to explain what I mean?
It's really so hard to understand that the chart in my post is not question of a greenredlongshortcandlestick or trend prediction but a visual aid to visualize EOD references data?
It's really so hard multiply x 3 that example?

Well .. ... maybe this is more clear, using same data but x3 now ... maybe .. eventually ask me, I tend to respond directly to questions...

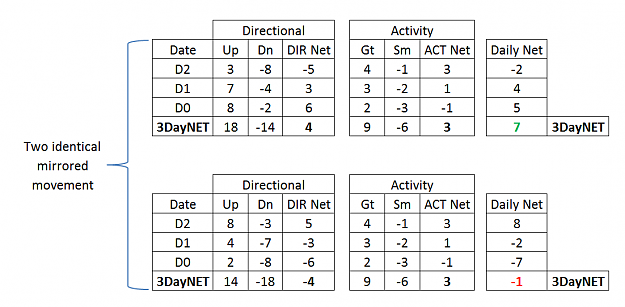
Why we have 2 different absolute net value if the 3 day flow is identical but mirrored?
Is correct? Why in your opinion?
Is not correct? Why in your opinion?

TY
Attached Image (click to enlarge)
Click to Enlarge

Name: 3dayxls.png
Size: 34 KB
 
 
  • Post #1,208
  • Quote
  • Edited 11:05pm Jun 20, 2017 6:03pm | Edited 11:05pm
  •  thetail
  • | Joined Oct 2016 | Status: Member | 80 Posts
And this is from the data in your post ( days 10, 13, 14 at the bottom of the screenshot) https://www.forexfactory.com/showthr...26#post9997226
Attached Image (click to enlarge)
Click to Enlarge

Name: 3dayxls2.png
Size: 31 KB
 
 
  • Post #1,209
  • Quote
  • Jun 21, 2017 6:25am Jun 21, 2017 6:25am
  •  mzvega
  • Joined May 2009 | Status: Member | 1,879 Posts
Quoting thetail
Disliked
{quote} It's really so hard to understand that my post is an example to explain what I mean? It's really so hard to understand that the chart in my post is not question of a greenredlongshortcandlestick or trend prediction but a visual aid to visualize EOD references data? It's really so hard multiply x 3 that example? Well .. ... maybe this is more clear, using same data but x3 now ... maybe .. eventually ask me, I tend to respond directly to questions... Why we have 2 different absolute net value if the 3 day flow is identical but mirrored? Is...
Ignored
Quoting thetail;
Disliked
Other nick take the same validation test on same data that Jones used, with "classic" Jones method take a 88.37% validation, with the sign change the validation is 93.33% .... not a big difference but changing the sign gives better results......
Ignored
If Nick can "take the same validation test with the sign change the validation is 93.33%", he's obviously qualified to answer your questions... it's better that you seek help and advice from Nick........
Markets are not efficient, rather they are effective - Jones
 
 
  • Post #1,210
  • Quote
  • Jun 21, 2017 7:00am Jun 21, 2017 7:00am
  •  thetail
  • | Joined Oct 2016 | Status: Member | 80 Posts
Quoting mzvega
Disliked
{quote} {quote} If Nick can "take the same validation test with the sign change the validation is 93.33%", he's obviously qualified to answer your questions... it's better that you seek help and advice from Nick........
Ignored
Again ... a direct and clear question, no direct and clear answer.
A problem that more than one person has had on the subject and that inexorably slows learning is still unanswered ...
Maybe with your answer and a common work we could get 100% validation ... no?

Ok, no problem, everyone has his style in forums and in life.
Have a good day and thank you for your time.
 
1
  • Post #1,211
  • Quote
  • Jun 21, 2017 5:25pm Jun 21, 2017 5:25pm
  •  mzvega
  • Joined May 2009 | Status: Member | 1,879 Posts
Quoting nonlinear
Disliked
Tail, it looks like cisco is taking the average of the last three days and comparing it to the oldest day to give an estimate of increasing or decreasing. I don't know if that is prudent or not, but that is what it looks like to me...
Ignored
Here is some food for thought……...

We have established that there is no "day to day" serial correlation……
Comparing one day's data to the previous day's data produces random like results
https://www.forexfactory.com/showthr...88#post9825088

Comparing one days data to the previous days data is not a large enough sample of data to see evidence of any underlying trend
https://www.forexfactory.com/showthr...40#post8954540
Markets are not efficient, rather they are effective - Jones
 
1
  • Post #1,212
  • Quote
  • Jun 21, 2017 5:42pm Jun 21, 2017 5:42pm
  •  nonlinear
  • Joined Sep 2007 | Status: simmer down now | 1,251 Posts
Yes, thanks for those; that makes good sense, mzvega. When learning this vbpt approach, I find it necessary to read the various source materials multiple times. It is easy (at least for me) to gloss over items that seem initially inconsequential only to later discover significance on a later read. Slow going. I am just getting to the difficult point of trying to interpret the data real-time, and the more I try to do that, the more I see the need for a solid foundation of what each piece of data means.
 
 
  • Post #1,213
  • Quote
  • Jun 22, 2017 4:06am Jun 22, 2017 4:06am
  •  thetail
  • | Joined Oct 2016 | Status: Member | 80 Posts
Quoting mzvega
Disliked
{quote} Here is some food for thought... We have established that there is no "day to day" serial correlation Comparing one day's data to the previous day's data produces random like results https://www.forexfactory.com/showthr...88#post9825088 Comparing one days data to the previous days data is not a large enough sample of data to see evidence of any underlying trend https://www.forexfactory.com/showthr...40#post8954540
Ignored
So you are saying that we must compare D2 and D0 and "discard" the middle D1?
In effect this way correct all the few incongruences that i found following the nonlinear ( the nick .. not the method..) intuition and results now are in line with cisco results and comments.
But, if it so, why don't compare D3 and D0 , since a 2 day gap in the sequence gives better results?
On cisco table there are only 3 days an not 4 days (so only a 1 day gap is possible)...

Or maybe this is not the right way...
 
 
  • Post #1,214
  • Quote
  • Jun 22, 2017 3:33pm Jun 22, 2017 3:33pm
  •  mzvega
  • Joined May 2009 | Status: Member | 1,879 Posts
Quoting nonlinear
Disliked
Yes, thanks for those; that makes good sense, mzvega. When learning this vbpt approach, I find it necessary to read the various source materials multiple times. It is easy (at least for me) to gloss over items that seem initially inconsequential only to later discover significance on a later read. Slow going. I am just getting to the difficult point of trying to interpret the data real-time, and the more I try to do that, the more I see the need for a solid foundation of what each piece of data means.
Ignored
Here are some things you might consider first when building a spreadsheet, net flow is useless absent of "context". How you use it depends on the condition/context of the market. You cant put netflow data in context if you dont know where you are within the "market unit" first (context).Net flow is secondary to the "market Unit" . . https://web.archive.org/web/20151106031518/http://www.cisco-futures.com:80/marketunit.html
Markets are not efficient, rather they are effective - Jones
 
1
  • Post #1,215
  • Quote
  • Edited 7:28pm Jun 22, 2017 5:29pm | Edited 7:28pm
  •  nonlinear
  • Joined Sep 2007 | Status: simmer down now | 1,251 Posts
Thank you, more reading

Based on my review of the net flow analysis, it seems clear that cisco is disregarding if a given day is not bracketing (has multiple distributions) for purposes of poc, and va upper/lower values. However, it seems to me that the poc, va upper and lower values have less merit when the daily profile is not bracketing. Why is it that the poc , va upper and lower references are taken into account for a non-bracketing day for purposes of net flow? I am guessing because daily non-bracketing means very little when the 5 day overlays is in fact bracketing, and that is one's starting point...
 
 
  • Post #1,216
  • Quote
  • Jun 25, 2017 1:58pm Jun 25, 2017 1:58pm
  •  mzvega
  • Joined May 2009 | Status: Member | 1,879 Posts
Quoting nonlinear
Disliked
Thank you, more reading Based on my review of the net flow analysis, it seems clear that cisco is disregarding if a given day is not bracketing (has multiple distributions) for purposes of poc, and va upper/lower values. However, it seems to me that the poc, va upper and lower values have less merit when the daily profile is not bracketing. Why is it that the poc , va upper and lower references are taken into account for a non-bracketing day for purposes of net flow? I am guessing because daily non-bracketing means very little when the 5...
Ignored
Short answer :A single day's profile "value area"doesn't fit the definition of "Value".
70% of where trade takes place everyday is just that, where 70% of where trade takes place, it infers neither balance or imbalance.

"Congestion or balance, as defined here, is a minimum trading period of three or more days forming a single distribution containing the close, which produces a stable upper and lower limit."
https://web.archive.org/web/20121118055310/http://www.cisco-futures.com:80/balances_three_day_rule.html

If balance/congestion is defined by three or more days forming a single distribution, then a single day's value area ( Daily profile) doesn't met the criteria of a "Balanced" bracketing market, Nor is a single day's profile enough info to determine if the market is not bracketing. The 70% value area is where 70% of trade took place that day. Nothing more, nothing less. it infers neither balance or imbalance. It tells you nothing about the underlying condition of the market.

When we use the word "Value", we are not using it interchangeably to mean "value area". We trade changes in "Value" (Big V) not "value" areas (Little v).
VBPT p. 38
Attached Image (click to enlarge)
Click to Enlarge

Name: va.JPG
Size: 72 KB


We don't trade daily market profiles, nor use the absolute values of daily references as relative trade locations. We don't use daily references for anything other than variables for analysis. 70% of where daily trade takes place infers neither balance or imbalance. So as a variable for analysis it doesn't carry any more or less merit as any other reference for the purpose of net flow. We're concerned with monitoring where 70% the majority of daily trades have taken place. It's of little consequence if the daily profile appears to be balanced or not. Rules concerning "Value", don't include "value area"
Markets are not efficient, rather they are effective - Jones
 
 
  • Post #1,217
  • Quote
  • Jun 26, 2017 1:19pm Jun 26, 2017 1:19pm
  •  nonlinear
  • Joined Sep 2007 | Status: simmer down now | 1,251 Posts
Thank you for the thoughtful explanation; much appreciated. I am basically creating an overlay indicator and spreadsheets from scratch, while also adding my own flavor on a few items according to my interpretation of the generated data, which is ongoing. Because of this I am keenly focused on what each piece of data tells me and how I can use it. It is, of course, a learning process to even come close to your and others' level of understanding and interpretation, which is why your comments in this thread are so useful. The cisco archive is also incredibly useful - was anyone here a student? I am curious how many pupils are still out there trading.
 
 
  • Post #1,218
  • Quote
  • Jun 26, 2017 6:46pm Jun 26, 2017 6:46pm
  •  nonlinear
  • Joined Sep 2007 | Status: simmer down now | 1,251 Posts
I'm looking at EU. Been bracketing on 20, 15 and 5. No real trend to follow, but Vty is rising again, 3 day flow flipped from negative to positive and then jumped higher on my calculations. tpo count favors sellers on 5 day overlay, but three day and one day counts are favoring buying activity. However RI is generally flat and still above .6 on 8d, both in 2nd Q. I favor a break of the 5 day ul into the upper node of the 10 day overlay. Will keep watching.
 
2
  • Post #1,219
  • Quote
  • Edited 8:35am Jun 27, 2017 8:14am | Edited 8:35am
  •  nonlinear
  • Joined Sep 2007 | Status: simmer down now | 1,251 Posts
Exit at node, will look to re-enter if 15 breaks.
Attached Image (click to enlarge)
Click to Enlarge

Name: Screenshot1.png
Size: 23 KB
 
4
  • Post #1,220
  • Quote
  • Jun 27, 2017 12:55pm Jun 27, 2017 12:55pm
  •  mzvega
  • Joined May 2009 | Status: Member | 1,879 Posts
Quoting nonlinear
Disliked
Exit at node, will look to re-enter if 15 breaks. {image}
Ignored
That worked out well for you!
I missed the initial move, however there was still as you mentioned with the 15d, opportunities to trade.
Again, great trade!

Not quite as complex as everyone makes it out to be
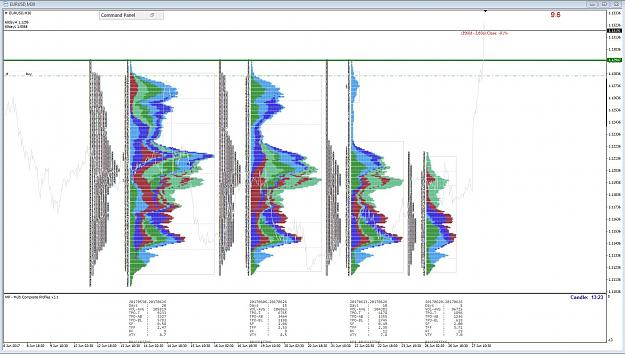
Attached Image (click to enlarge)
Click to Enlarge

Name: eu.JPG
Size: 389 KB
Markets are not efficient, rather they are effective - Jones
 
1
  • Trading Discussion
  • /
  • Auction Market Value Theory & Analytics
  • Reply to Thread
    • 1 5960Page 616263 81
    • 1 60Page 6162 81
0 traders viewing now
  • More
Top of Page
  • Facebook
  • Twitter
About FF
  • Mission
  • Products
  • User Guide
  • Media Kit
  • Blog
  • Contact
FF Products
  • Forums
  • Trades
  • Calendar
  • News
  • Market
  • Brokers
  • Trade Explorer
FF Website
  • Homepage
  • Search
  • Members
  • Report a Bug
Follow FF
  • Facebook
  • Twitter

FF Sister Sites:

  • Metals Mine
  • Energy EXCH
  • Crypto Craft

Forex Factory® is a brand of Fair Economy, Inc.

Terms of Service / ©2023