• Home
  • Forums
  • Trades
  • News
  • Calendar
  • Market
  • Brokers
  • Login
  • Join
  • User/Email: Password:
  • 5:34pm
Menu
  • Forums
  • Trades
  • News
  • Calendar
  • Market
  • Brokers
  • Login
  • Join
  • 5:34pm
Sister Sites
  • Metals Mine
  • Energy EXCH
  • Crypto Craft

Options

Bookmark Thread

First Page First Unread Last Page Last Post

Print Thread

Similar Threads

Auction Market Theory and Market Profile 22,206 replies

MarketProfile/Volume Profile/Auction Market Theory indi? 17 replies

ECN && STP && Scalping && Hedging - Broker Review - Oct 2009 24 replies

Auction Market Value Analytics Charts & Data 14 replies

Analytics, recommendations - S&P 500, Euro and other 11 replies

  • Trading Discussion
  • /
  • Reply to Thread
  • Subscribe
  • 1,025
Attachments: Auction Market Value Theory & Analytics
Exit Attachments
Tags: Auction Market Value Theory & Analytics
Cancel

Auction Market Value Theory & Analytics

  • Last Post
  •  
  • 1 5657Page 585960 81
  • 1 57Page 5859 81
  •  
  • Post #1,141
  • Quote
  • May 23, 2017 1:45pm May 23, 2017 1:45pm
  •  Evak
  • Joined May 2011 | Status: Member | 695 Posts
nice trade

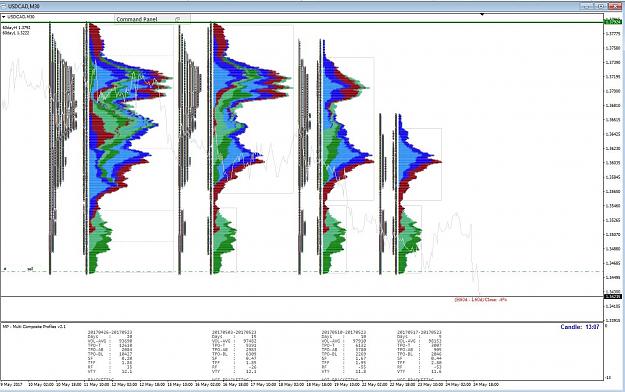
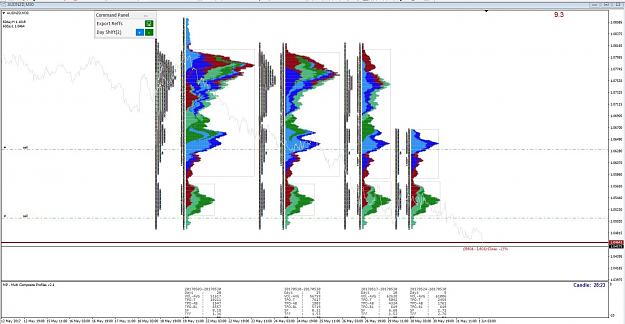
MY trade in usdcad hit my SL, price eventually goes down anyway after that. But yesterday TFF was slowing down abit that i would stay on the side of caution.

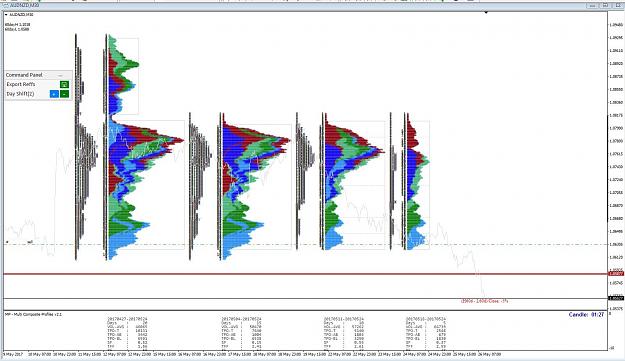
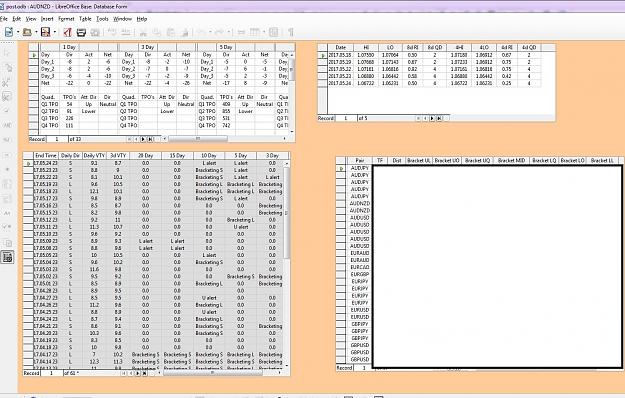
I caught some good trades on nzd and aud on Monday, price is moving so fast vertically up today too for the kiwi, I scale out by today prior to US session for both

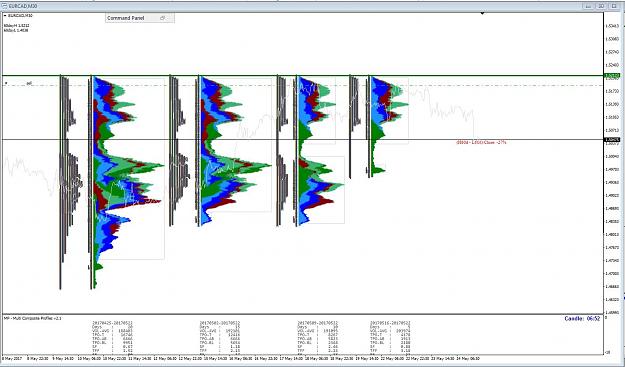
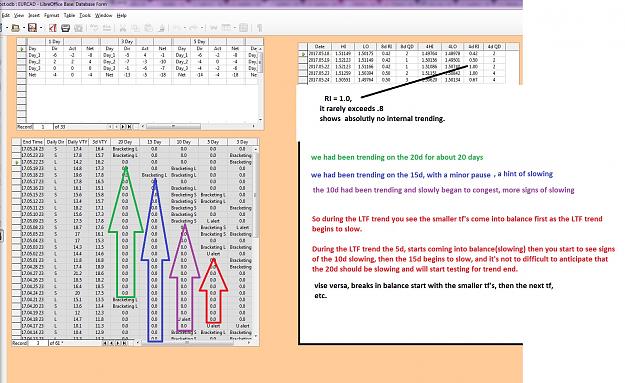
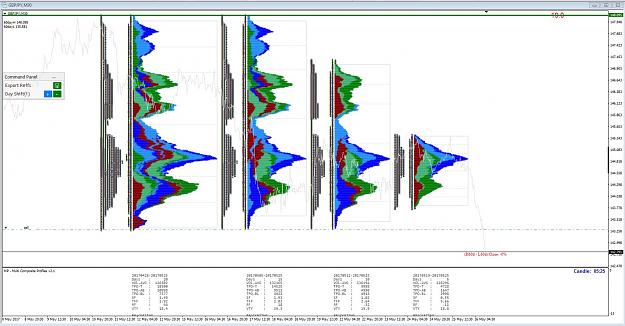
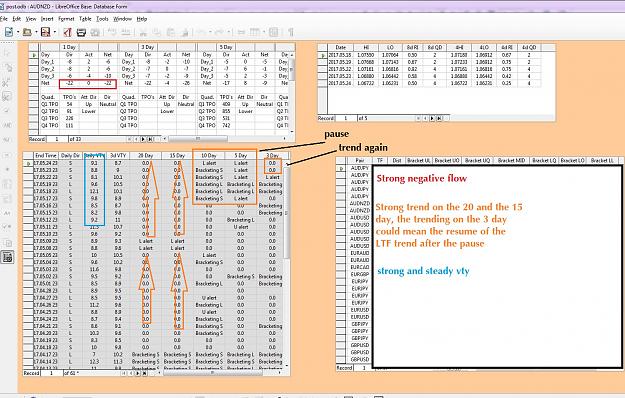
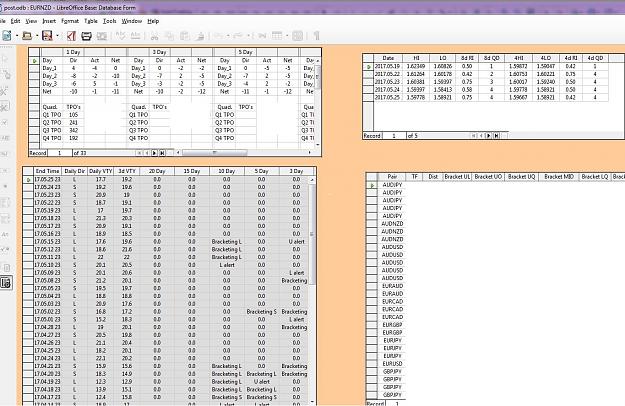
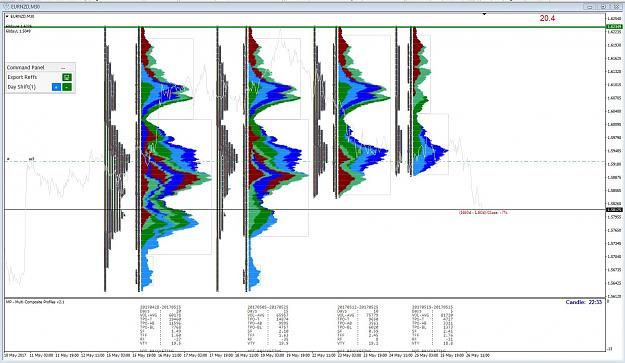
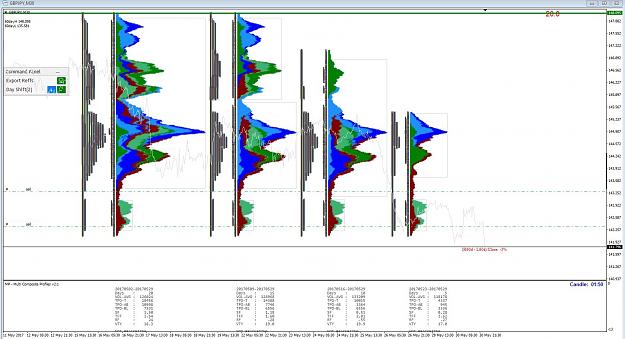
I got some nice trade on the EURUSD too last week but the 20 day SF is so skewed i avoided taking further trades once the capping sets in; And today's high volume shows it with AD & RF down mostly.
 
 
  • Post #1,142
  • Quote
  • May 24, 2017 3:35pm May 24, 2017 3:35pm
  •  mzvega
  • Joined May 2009 | Status: Member | 1,879 Posts
Attached Image (click to enlarge)
Click to Enlarge

Name: usdcad.JPG
Size: 312 KB
Attached Image (click to enlarge)
Click to Enlarge

Name: eurcad.JPG
Size: 256 KB
Markets are not efficient, rather they are effective - Jones
 
1
  • Post #1,143
  • Quote
  • May 25, 2017 4:12am May 25, 2017 4:12am
  •  dljonesFan
  • | Joined Oct 2015 | Status: Member | 159 Posts
Quoting mzvega
Disliked
{image}{image}
Ignored
great eurcad trade!
can you please explain the planning behind that trade?

greets
C
 
 
  • Post #1,144
  • Quote
  • Edited 6:58am May 25, 2017 6:40am | Edited 6:58am
  •  mzvega
  • Joined May 2009 | Status: Member | 1,879 Posts
Quoting dljonesFan
Disliked
{quote} great eurcad trade! can you please explain the planning behind that trade? greets C
Ignored
We start with the condition of an extended LTF trend, It's had a pretty good run. Eventually it has to at least pause to catch it's breath, or transition from trend to bracket. The shorter tf's one by one show signs of slowing (congesting).
The probabilities of the continuation of the current LTF trend couldn't be supported by the data.
Any break of a new bracket would most likely be a test for trend end, as we have been in an extended trend already, rather than a break into a new trend. Any break would most likely result in a test for trend end. Nothing in the data suggested break into a "new" trend. We just come off a 60d highs, etc...
I always try to stay aware of where we are within the "market unit"
Attached Image (click to enlarge)
Click to Enlarge

Name: eurocad.JPG
Size: 430 KB
Markets are not efficient, rather they are effective - Jones
 
2
  • Post #1,145
  • Quote
  • Edited 5:49am May 26, 2017 4:39am | Edited 5:49am
  •  mzvega
  • Joined May 2009 | Status: Member | 1,879 Posts
Attached Image (click to enlarge)
Click to Enlarge

Name: audnzd1.JPG
Size: 292 KB
Attached Image (click to enlarge)
Click to Enlarge

Name: audnzd.JPG
Size: 382 KB
Markets are not efficient, rather they are effective - Jones
 
1
  • Post #1,146
  • Quote
  • Edited 5:49am May 26, 2017 5:27am | Edited 5:49am
  •  mzvega
  • Joined May 2009 | Status: Member | 1,879 Posts
Attached Image (click to enlarge)
Click to Enlarge

Name: gbpjpy.JPG
Size: 346 KB
Attached Image (click to enlarge)
Click to Enlarge

Name: gbpjpy1.JPG
Size: 359 KB
Markets are not efficient, rather they are effective - Jones
 
1
  • Post #1,147
  • Quote
  • May 26, 2017 5:29am May 26, 2017 5:29am
  •  stain
  • | Joined Mar 2015 | Status: Member | 34 Posts
Quoting mzvega
Disliked
{image}
Ignored
Great trade [audnzd], can you publish the other data y have whitout a commentary ? wonna look at your data and see what i can figure it out, if you don't mind.

Based on the chart y have posted what stands out (to me !) is the predominance of the TPO belowe (sell pressure), an increasing volume with an increasing TFF (above the 2.40 on the 5-10-15 profiles [wich is an high value in a scale of 1 to 3]).
 
 
  • Post #1,148
  • Quote
  • May 26, 2017 6:09am May 26, 2017 6:09am
  •  stain
  • | Joined Mar 2015 | Status: Member | 34 Posts
any comment and correction will be appreciated
Attached Image (click to enlarge)
Click to Enlarge

Name: audnzd.JPG
Size: 429 KB
 
 
  • Post #1,149
  • Quote
  • May 26, 2017 6:43am May 26, 2017 6:43am
  •  mzvega
  • Joined May 2009 | Status: Member | 1,879 Posts
Quoting stain
Disliked
{quote} Great trade [audnzd], can you publish the other data y have whitout a commentary ? .
Ignored
Probably because it's 3:30 in the morning my time………
Markets are not efficient, rather they are effective - Jones
 
 
  • Post #1,150
  • Quote
  • May 26, 2017 6:58am May 26, 2017 6:58am
  •  stain
  • | Joined Mar 2015 | Status: Member | 34 Posts
Quoting mzvega
Disliked
{quote} Probably because it's 3:30 in the morning my time
Ignored
have a nice rest ...sleep deprivation could kick your ass so badly (talking from experience, lol)
 
 
  • Post #1,151
  • Quote
  • Edited 10:45pm May 26, 2017 2:13pm | Edited 10:45pm
  •  mzvega
  • Joined May 2009 | Status: Member | 1,879 Posts
Quoting stain
Disliked
{quote} wonna look at your data and see what i can figure it out, if you don't mind. Based on the chart y have posted what stands out (to me !) is the predominance of the TPO belowe (sell pressure)...................
Ignored
What is the purpose of tpo count? How is tpo count used for analysis.?
"predominance of the TPO belowe (sell pressure)"

What is the purpose of tpo count?
How is tpo count used for analysis.?
TPO count tells you what?

Quoting stain
Disliked
what stands out (to me !) is the predominance of the TPO belowe (sell pressure)...................
Ignored
"

I am having trouble understanding.........can you explain what this means?
Markets are not efficient, rather they are effective - Jones
 
 
  • Post #1,152
  • Quote
  • May 26, 2017 2:45pm May 26, 2017 2:45pm
  •  mzvega
  • Joined May 2009 | Status: Member | 1,879 Posts
Attached Image (click to enlarge)
Click to Enlarge

Name: eurnzd1.JPG
Size: 341 KB
Attached Image (click to enlarge)
Click to Enlarge

Name: eurnzd.JPG
Size: 309 KB
Markets are not efficient, rather they are effective - Jones
 
 
  • Post #1,153
  • Quote
  • May 30, 2017 6:04pm May 30, 2017 6:04pm
  •  mzvega
  • Joined May 2009 | Status: Member | 1,879 Posts
Quoting mzvega
Disliked
{image} {image}
Ignored
gbpjpy
Attached Image (click to enlarge)
Click to Enlarge

Name: gbpjpy2.JPG
Size: 291 KB
Markets are not efficient, rather they are effective - Jones
 
 
  • Post #1,154
  • Quote
  • Edited 7:08pm May 30, 2017 6:56pm | Edited 7:08pm
  •  nonlinear
  • Joined Sep 2007 | Status: simmer down now | 1,251 Posts
I have been reviewing file outputs from the composite indicator and am curious about TPO above and below counts for overlays that are bracketing versus not-bracketing. Perhaps I am mistaken, but it seems that the POC level (and hence the TP above/below counts) is determined by the same rules for bracketing versus not-bracketing overlays. If so, it seems like the TPO ratio could poorly reflect buying and selling pressure for larger overlays, especially when price activity has been active for days around a new node far away from the overlay POC. Thank you. Edit: but then again, that buying and selling pressure should be evident on the lower overlays. Maybe I answered my own question lol
 
 
  • Post #1,155
  • Quote
  • Edited 10:21pm May 30, 2017 8:57pm | Edited 10:21pm
  •  mzvega
  • Joined May 2009 | Status: Member | 1,879 Posts
Quoting nonlinear
Disliked
I have been reviewing file outputs from the composite indicator and am curious about TPO above and below counts for overlays that are bracketing versus not-bracketing. Perhaps I am mistaken, but it seems that the POC level (and hence the TP above/below counts) is determined by the same rules for bracketing versus not-bracketing overlays. If so, it seems like the TPO ratio could poorly reflect buying and selling pressure for larger overlays, especially when price activity has been active for days around a new node far away from the overlay POC. Thank...
Ignored
There are different ways "tpo count" is used for analysis. TPO count in the context in which you speak, (above/below) . Carries significance in balanced/bracketing in conditions. However tpo counts are used as other references i.e. TFF (trade facilitation factor), LTF control, etc.. Tpo counts in various way tell you different things about the market. Depends on the context. The raw data itself is pretty much useless unless you've learned how to use the data first...

in the context in which you speak, (above/below) , it's not about the values themselves, it is what the counts infer. Knowing if there are more tpos above or below carries no informational value without Understanding the logic of "why" & "how".

Let's make sure we're on the same page and we both have and understanding of the same basic auction market principles........TPO count in the context of above/below....................

In a bracketing condition what does more tpo's above the poc infer? And can you explain why?

In a bracketing condition what does more tpo's below the poc infer? And can you explain why?

Quoting nonlinear
Disliked
Edit: but then again, that buying and selling pressure should be evident on the lower overlays.
Ignored
not necessarily...............


Edit: I am surprised no one can, off the top of their heads, answer the question. I thought for sure stain would have answered, when I asked the same question a post or two ago.......
Markets are not efficient, rather they are effective - Jones
 
 
  • Post #1,156
  • Quote
  • May 30, 2017 10:20pm May 30, 2017 10:20pm
  •  nonlinear
  • Joined Sep 2007 | Status: simmer down now | 1,251 Posts
In a bracketing overlay covering longer periods, more tpo's above the poc typically infers downward pressure because more traders above the poc are trading short than buyers below trading long -- pure auction activity in a balanced market (if i have that wrong, then....). I have mixed views though when non-bracketing conditions exist and where one should "define" the poc, which affects other references, as you noted. Considering a 20 day overlay where the POC defined at 1000 15 days ago and price is now at a clear (but smaller) node at 900, where one considers the POC, will greatly affect the tpo's considered above and below and whether or not there is buying/selling pressure for that overlay at the time the 20 day tpos are measured. It is an interesting inquiry to me.
 
 
  • Post #1,157
  • Quote
  • May 31, 2017 4:20pm May 31, 2017 4:20pm
  •  mzvega
  • Joined May 2009 | Status: Member | 1,879 Posts
Quoting nonlinear
Disliked
In a bracketing overlay covering longer periods, more tpo's above the poc typically infers downward pressure because more traders above the poc are trading short than buyers below trading long -- pure auction activity in a balanced market (if i have that wrong, then....).
Ignored
In that you are correct........

"The total TPO figure above the point of control represents other timeframe traders willing to sell and stay short above value, while total TPOs below the point of control represent other timeframe traders willing to buy and stay long below value"

Quoting nonlinear
Disliked
I have mixed views though when non-bracketing conditions exist and where one should "define" the poc, which affects other references, as you noted.
Ignored
That's the point you cant. In a trending market there is no POC

According to MP profile nomenclature:
To calculate a value area you locate the central 70 percent of tpo/volume,
The count starts at the price with the peak tpo's/volume (Point of Control)
In MP profile nomenclature every day "assumes" balance (VA).

AMVT is not MP. This was studied and discussed several times in the source material already posted to the thread..explaining why the 70 percent formula fails.."

"Simply imagine a market in which price rises steadily, at the same rate, throughout a day. There will be the same number of TPOs at each price. Such a distribution has no POC with which to start the count. More to the point, what is 'value' in a trending market? Value comes from a consensus in a bell shaped distribution. There, some traders believe value is higher than the POC; an essentially equal number think value is lower than the POC. This stand-off explains the quasi-bell shaped curve of the profile in congesting markets. Moving markets generally do not have a bell shaped distribution. In the non-balance situation the snapshot calculated value is misleading at the least. At worst, it can lead to trading for the wrong reason.

So the the key is that valid value can only be found when the market is in a balanced (congesting) state. Consequently, a precondition for valid value determination is balance; so then we must define what balance means in market measureable terms."
https://web.archive.org/web/20150630003733/http://www.cisco-futures.com:80/balances_three_day_rule.html

Quoting nonlinear
Disliked
. Considering a 20 day overlay where the POC defined at 1000 15 days ago and price is now at a clear (but smaller) node at 900, where one considers the POC, will greatly affect the tpo's considered above and below and whether or not there is buying/selling pressure for that overlay at the time the 20 day tpos are measured.
Ignored
This isn't MP, we are not using a series of MP's or POC's from 15 days ago, nor do we use or compare this 20day distribution with the previous 20 day distribution, you are trying to understand AMVT using MP methodology.......Again, this is not MP, nor is MP methodology applicable to what we do here...... I don't think you understand how overlays construction is used for analysis in AMVT

People put way too much emphasis on a single reference..If you read VBPT you'll see POC isn't even mentioned in the index.

The concept of POC implies Value/balance. This isn't MP..the concept of a 70% value area doesnt apply to overlays. Those familiar with the source material have learned this...

"The common thread running through all our studies is validity of the data. If trading is to be a science, the data used in the analyses must be valid. The original Market Profile analyses, and still today, treats any calculated value area as a valid measure of value; with further analyses proceeding from that assumption. But our work on Market Condition has shown that a one day snapshot profile may not be representative of a market and often is not. Consequently, relying on simple reference points (point of control, value area) can give a totally misleading read of a market. If your data is not valid, how can you possibly succeed by following it?..............................."
https://www.forexfactory.com/showthr...23#post8682223
Markets are not efficient, rather they are effective - Jones
 
1
  • Post #1,158
  • Quote
  • May 31, 2017 5:47pm May 31, 2017 5:47pm
  •  mzvega
  • Joined May 2009 | Status: Member | 1,879 Posts
TPO counts have other uses besides above & below the POC. TPO counts (measured in different ways) are used in other ways and other references.
TPO counts "above & below" the POC has significance in bracketing conditions. In non bracketing markets , TPO counts (measured in different ways) are used in other ways.

POC has a certain significance in bracketing conditions, In non bracketing markets , POC has little significance in the context of tpo's above or below. However POC as a reference (is used & measured in different ways) relative other references providing other types of info.

You're looking at the raw data…………it will always show an abv/bl tpo count because the counts are used for other purposes, not just above & below the POC
POC has little significance in non bracketing markets. However POC as a variable is used in conjunction/relative to other variables providing other types of info.

Those familiar with the source material, would have learned to discriminate when and under which conditions to use references and when they do not apply to the case at hand.

Not all reference points are important in any one case. You must learn about each of them and how to discriminate. In some profile teaching the operative word is 'holism', looking into the pot with some 30 or so elements and somehow divining which control the taste today. Value Analytics goes the other way, separating the elements, measuring them and their flow individually and eliminating those that do not apply to the case at hand.

Feedback is involved: if your understanding of a particular item (say trade facilitation) is in error and you continually make that error in your market strategy; your error will become apparent to you rather quickly. This illustrates the value of isolating the reference points and examining them individually.
https://www.forexfactory.com/showthr...25#post7500925

Each variable gives an individual piece of information about what the market is doing, independently of all the others. If the volume is increasing over the past three days, that is a piece of information separate from being concerned about what the, say range extension, is doing. Increasing volume is an alert to a coming breakout in a balanced market or of a continuing trend in a distributing market. You have two dozen additional reference points that may or may not confirm this observation. But each is analytical, i.e. has a numerical value that permits you to understand it as it varies with changes to market condition. Value Analytics lets you consider each variable separately. Once you have done that, you can now consider how they fit together, what the main tendency is. https://www.forexfactory.com/showthr...97#post9027697

A balanced profile in a balanced market phase would be interpreted differently than the same profile within a trending market.
https://www.forexfactory.com/showthr...20#post7829420


The complex nature of the market is a strong argument for a phenomenological approach to market theory. A market has many facets, elements that are functional parts, but still with a large degree of independence in their behavior. As one of these elements changes, that changed behavior is returned to the market via the feedback mechanism. While elements such as volume, volatility, range, time behavior and the like are individually measureable, they all combine to form the market one studies or trades. Each element must be discovered and studied on its own before there is any thought of considering how it affects the whole. The vital question of extreme market behavior such as large, fast changes in value, must be understood. It is the thesis of Auction Market Value Theory that each of the market elements can be isolated and must be understood prior to forming a coherent description of a market. The experienced trader collects all the market information available, assesses each piece, ending with an understanding of the market situation. Not all pieces are necessarily needed to find the market's condition. Different sets will be used at different times.
https://www.forexfactory.com/showthr...73#post7490173
Markets are not efficient, rather they are effective - Jones
 
1
  • Post #1,159
  • Quote
  • May 31, 2017 6:36pm May 31, 2017 6:36pm
  •  nonlinear
  • Joined Sep 2007 | Status: simmer down now | 1,251 Posts
Thank you for the clarification. Yes, I see now that poc only applies to bracketing overlays. I was confused because the indicator calculates poc for nonbracketing overlays, which didn't make sense in view of the examples of chapters 5 &6 of vbpt.
 
 
  • Post #1,160
  • Quote
  • Jun 1, 2017 12:39am Jun 1, 2017 12:39am
  •  mzvega
  • Joined May 2009 | Status: Member | 1,879 Posts
Quoting mzvega
Disliked
{image} {image}
Ignored
audnzd
Attached Image (click to enlarge)
Click to Enlarge

Name: audnzd2.JPG
Size: 304 KB
Markets are not efficient, rather they are effective - Jones
 
 
  • Trading Discussion
  • /
  • Auction Market Value Theory & Analytics
  • Reply to Thread
    • 1 5657Page 585960 81
    • 1 57Page 5859 81
1 trader viewing now
  • More
Top of Page
  • Facebook
  • Twitter
About FF
  • Mission
  • Products
  • User Guide
  • Media Kit
  • Blog
  • Contact
FF Products
  • Forums
  • Trades
  • Calendar
  • News
  • Market
  • Brokers
  • Trade Explorer
FF Website
  • Homepage
  • Search
  • Members
  • Report a Bug
Follow FF
  • Facebook
  • Twitter

FF Sister Sites:

  • Metals Mine
  • Energy EXCH
  • Crypto Craft

Forex Factory® is a brand of Fair Economy, Inc.

Terms of Service / ©2023