Bulls are stupid Animals!especially when Im short!
Similar Threads
Auction Market Theory and Market Profile 25,163 replies
MarketProfile/Volume Profile/Auction Market Theory indi? 17 replies
ECN && STP && Scalping && Hedging - Broker Review - Oct 2009 24 replies
Auction Market Value Analytics Charts & Data 14 replies
Analytics, recommendations - S&P 500, Euro and other 11 replies
- Joined Mar 2012 | Status: turning probability into profit | 1,550 Posts
Disliked{quote} CBOT Market Profile, 1985, listed three day types. CBOT Market Profile, 1991 had four. Steidlmayer on Markets, 1989, lists six. MOM, 1990, has nine. Steidlmayer on Markets, 2003, lists five. Markets in Profile, 2007, does not have an index item for Day Type! The primary writers in the area do not agree with each other or even themselves on the number of basic day types that exist. If The primary writers in the area do not agree with each other or even themselves on the number of basic day types that exist, What does that say about Market...Ignored
Best
D.P.
DislikedStrategies, Models and Auction Market Trading cont'd......... In the Beginning... Beginners in most professional fields start with a course of instruction. Following the instruction/introduction phase, there is an apprenticeship. A successful apprenticeship leads to "journeyman" status, where the individual becomes a member of the professional community, making a living from his/her efforts. Some few rise higher, becoming masters; teachers, innovators, gurus. The standards developed by most professions do not exist for traders. There are no auction...Ignored
Hunting High and Low
- Joined May 2009 | Status: Member | 1,879 Posts
DislikedThank you mzvega, will save this into a word document, an awesome postIgnored
Strategies, Models and Auction Market Trading
Donald L. Jones May 11, 2002
Strategies, Models and Auction Market Trading........
A trading model is a plan of action for the trader. It may be explicit as in a moving average crossover breakout or as intuitive as pattern recognition.An auction market model is the result of a three step strategy development process. These are Market Strategy, Trader Strategy and a synthesis of the two, theWorking Strategy.
Market Strategy is determined by the market itself, by the characterisics that define it. It may be a short timeframe market with a lot of action packed into minutes or even seconds, like the indexes. Or, it may be a longer timeframe, more sedate market like the grains. An auction market study of a market reveals that market's behavior, its condition, and hence the strategy one must employ trading it.
Secondly, the trader has characteristics and preferences; timeframe, risk, markets to trade, account size and so forth. These go to make Trader Strategy. Traders control their Trader Strategy, but Market Strategy is what the market offers. Working Strategy is a synthesis of Market Strategy and Trader Strategy. One's plan, or model comes from the Working Strategy.
Market Strategy
Traders want to catch a trend and ride it to congestion. This happens only under the right conditions. The market must cooperate, offering opportunity. The trader must understand the market well enough to know when it is in or approaching a cooperative mode. A market's condition describes for you it's "reference points". These are the measuring sticks, each telling something about a particular market feature. Reference points show the phase of the market (balance, trend or transitional), its current risk, its historic risk, its value, the volatility (and how it is changing), volume (and how it is changing), the behavior of the commercial traders and a number of others. More advanced analysis in the Advice Engine examines the trading potential of the current market in "absolute terms". Reference points are like the pieces of a jig-saw puzzle. Combining the parts describes the market. Putting the parts together makes the Market Strategy.
A typical Market Strategy for a market in balance would specify entry points, risk, internal trends, current value and its center, commercial traders behavior, trading range compared to the norm, shape of the price-time bell curve, recent behavior of the market and any trends in volume and volatility. Market Strategy provides a market-based plan of trade entry, i.e. where the market offers opportunity.
Examining the same market after it has begun to trend alters the focus. Many of the same reference points are still important (commercials, volume, volatility, value and the like). But now congestion governs. Has the trading range become limited? Is the price-time curve bunching?. Have the commercials capped the trend? Is volatility dropping? Is volume easing? Market Strategy is now the search for clues for a transition to congestion.
Trader Strategy
Trader Strategy is based on the trader's situation and requirements. It may overrule market strategy. For instance, a market may still be showing trend, but if the trader meets a target, an exit will be taken anyway. Or a timeframe may be set (exit no later than 15 minutes before the close). Or a risk limit may be different from that found in the Market Strategy. Trader Strategy adds the imprint of the trader to the overall trading methodology.
Working Strategy
Working Strategy is a combination of Market Strategy and Trader Strategy. Market Strategy undergoes large changes on a daily basis. Trader Strategy is less variable. One picks markets to trade, risks to take, hours to work, etc. That strategy changes when a trader changes (e.g. trade DJ indexes instead of SP's) or broadens the base of trading from one future to several. A Working Strategy is unique to the trader. No one else will have the personal input even if they start with the identical Market Strategy.
Trading Plan/Model
Models arise from the Working Strategy. They are intimately related to the trader. A model is a codification of procedures the trader has found that work. It includes the elements of market analysis in the Market Strategy, the preferences and idiosyncrasies of the trader and the knowledge gained by the trader from actual trading. As in any successful business, a successful trader develops a 'feel'. This is not magic. It is experience. Much of it comes from making mistakes and learning from them. Another part is from observing markets in many conditions and seeing what follows. While intangible, 'feel' is a very real part of developing and trading a model.
The path from Market Strategy to Trader Strategy to Working Strategy and finally to a trading plan/model is the "trading equation". Mathematically it is
Market Strategy + Trader Strategy = Working Strategy ==> Trading Plan/Model.
The trading equation is a strong argument against purchasing a commercially available trading model. Such a model cannot fulfill the trading equation, since it cannot include the trader's strategy. A trader is forced to have a trader strategy because it fits his/her particular situation. Commentators on technical analysis regularly point out that people who purchase models do not follow them. The purchased model is only a part of the equation.
In the Beginning...
Beginners in most professional fields start with a course of instruction. Following the instruction/introduction phase, there is an apprenticeship. A successful apprenticeship leads to "journeyman" status, where the individual becomes a member of the professional community, making a living from his/her efforts. Some few rise higher, becoming masters; teachers, innovators, gurus.
The standards developed by most professions do not exist for traders. There are no auction market schools. There are no organized apprenticeship programs for auction market traders. The beginner, convinced of the potential benefits of trading, is on his own. He/she reads magazines, books and gets ideas from the internet and other traders. Inevitably the search for understanding leads to a "perceived" need for a "model". There are many models in books, magazines and explained in weekend seminars. Such models address the 'Market Strategy' part of the trading equation and at best provide only a partial answer. Most (all?) of the 'sure fire' models do not work. Unfortunately, the beginner does not realize that "a model that works" is worth it's weight in gold and no one would sell such a valuable commodity.
Technical Analysis: A Bum Steer
The path of least resistance for the beginner is technical analysis. It is offered and discussed widely. Methods for calculating market 'indicators' are prevalent. At best, technical analysis deals only with first part of the 'trading equation', i.e., with the Market Strategy, leading to a "model". Widely used, to little apparent avail, technical analysis plays a prominent role for many in getting started in trading. Learning to calculate a moving average or oscillator is hardly the answer when one does not understand the market.
What Path to Take?
Lacking formal educational facilities, the career path for traders, is not well defined. It is certainly clear that one must understand markets well enough to divine the Market Strategy for that market at that point in time. It is equally clear that one must define one's own strategy, which operates within what the market offers. Only then can a reasonable trading plan be developed. How can one find the market's strategy? And then one's own strategy? And then a plan. One set of steps follow.
Learning to Trade
The Steps:
1) Learn market structure. Learn the foundation principles of markets.
2) Learn to 'read' markets; which ones offer opportunity and at what risk. Application of market principles leads to Market Strategy.
3) Define one's strategy: time frame?, activity level?, maximum risk? reward? This knowledge provides Trader Strategy.
4) Synthesize Market Strategy and Trader Strategy into a Working Strategy. The Working Strategy is the trader's plan of attack.
5) Find the market details, the current 'reference points'. Integrating the current reference points into one's Working Strategy becomes one's trading plan. The strategy now has numbers, a guide to action.
Step 1. Market Principles: Auction Market Theory
Auction market principles are found in Auction Market Theory. An abbreviated version of the theory is published in Stocks & Commodities, June/July 2002. A more complete version is on the CISCO website, under "Whats New". Theory provides the framework for analysis--those principles to follow. Theory shows the trader what to look for in a market. Once the market is defined, theory positions one to find a market based strategy. Theory guides the trader in dissecting the market. As a result, a trader gains an understanding of opportunity offered by the market and the risk inherent in that market at that point (say the end of a market day). These variables change with time, often within 24 hours or less.
Step 2. Market Strategy: Applying Auction Market Principles
Market Strategy comes from a market's current condition. For example, if a market is in balance, the upper and lower breakout prices are known. The balance range is known. Price exceeding the upper or lower limit is a 'breakout', an alert for the beginning of a trend. Also known are the balance 'value area' and 'point of control'. Breakouts from balance give an'opportunity' measure which permits a cataloging of that market's potential for trading. The balance range can be translated into a risk measure. Trading points are developed from limits and value areas. Overall trading potential comes from the opportunity /risk ratio (reward-to-risk ratio). Markets can be compared by their reward-to -risk ratios. Those with a currently too low reward-to-risk ratio would not be traded.
If the market condition is not balanced, less is specified by the market parameters. It is generally more risky to trade. If a clear trend is in place the day trader knows to go with the trend. The long term trader who did not get in near the breakout has missed the lower risk trade. Playing 'catch up' is a much higher risk strategy.
Regardless of outlook, the auction market trader has information that illuminates the market, aiding in action decisions. Still, the trader must keep in mind that there are only two goals: get into a trend early, exit when the trend begins congesting.
The market will tell you it's condition, volume path, volatility path, commercial behavior, congestion, member's intentions, tradeability, etc.
Market information sets a strategy unique to this market at this time:
A balanced market will breakout at some point in time.
A trending market will always come into congestion. ("come into congestion" is not used "interchangeably" to mean the same thing as "reversion to the "mean")
The market may be distributing (moving) or congesting--Auction market analysis tells which.
Members intentions (commercial capping) are on the Visual Graphic.
Tradeability overall comes from Advice Engine studies.
Ditto for reward to risk ratios.
Step 3. Trader Strategy: Investment, Risk Aversion, Timeframe
Trader Strategy reflects the needs of the trader. It must fit within the guidelines set by the Market Strategy. If the market is in balance, one path is followed, if not, another. If the overall reward-to-risk ratio is poor, the market is rejected. Exactly how trades are made depends on the trader's outlook--day trader, long time-frame trader or anything in between. Included are the trader's risk preferences, market preferences, times to trade and any other variable unique to the individual.
Some Restrictions on Trader Strategy
Size of account limits futures traded and time held.
Number of contracts in the entry trade are limited.
Extreme volatility equates to large risk: do you want this?
Holding overnight carries longer term risk: do you want this?
Active day trading requires constant attention: do you want this?
Information on Market Strategy is factored in.
Step 4. The Working Strategy
With Market Strategy and Trader Strategy determined, a Working Strategy comes from synthesizing the two. Worked out are risk parameters and limits, state of the market, timing of trades, exit strategy, etc.This is your contingency plan for a varied set of possibilities.
Step 5. Trading Your Plan: Reference Points
A trader builds trading decisions within the conditions set by the market and his/her Trader Strategy. It is a 'model' in the sense that the trader has a plan of action, but not the sort of exact model a beginner has in mind.
The trader takes what the market offers (Market Strategy) and works within that framework. The basic trading plan is simplicity personified: "get on a trend early and exit when it is over". Execution of the basic plan, using the information in the Working Strategy, is the trading model……….
Strategies, Models and Auction Market Trading
Donald L. Jones May 11, 2002
https://web.archive.org/web/20150814...gmodeldev.html
Markets are not efficient, rather they are effective - Jones
- Joined May 2009 | Status: Member | 1,879 Posts
Disliked{quote} Mzvega, Thanks for clarification notes. No questions to be asked. Best D.P. {quote}Ignored
Markets are not efficient, rather they are effective - Jones
- Joined Jan 2011 | Status: Senior Trader | 1,475 Posts
Bulls are stupid Animals!especially when Im short!
- | Joined Oct 2015 | Status: Member | 159 Posts
My favorite quote of the day:
Question: "Do you look at volume profiles? And if not why?"
Jim Dalton: "No, I do not look at volume profiles [...] volume profiles takes away the component of time."
Question: "Do you look at volume profiles? And if not why?"
Jim Dalton: "No, I do not look at volume profiles [...] volume profiles takes away the component of time."
- Joined Mar 2012 | Status: turning probability into profit | 1,550 Posts
How do you think?
Best
D.P.
Hunting High and Low
Greetings Mzvega,
I wonder if I could ever attain (even if approximately) your level of understanding in the AMVAT methodology. I need your help with regard to the following issues :
1) How many Reference Points do you use when you derive the Net Flow (ie. "Direction" + "Activity")? Specifically, could you please enumerate the best reference points to include in the calculation of the Net Flow - it appears some of the data is being repeated in different reference points, for example, Q1 TPO, Q2 TPO, Q3 TPO, Q4 TPO, then TPO T (ie TPO Total); Dist#1 UL, Dist#1 LL, etc
I am using about 34 Reference Points and I think they are too many and hence giving me spurious results.
2) Sometimes I get conflicting Net Flow data/sum and I am usually confused as to which one to use or rely on. For example, I could get Net Flow of -12 on the 1 day Overlay/Profile graphic, whereas the 3 day and 5 day Overlay distributions yield +3 and +7 respectively. Given such a scenario, which one supersedes the others?
3) I have also observed that many times there is an imbalance of buyers over sellers on the 3 day overlay, whereas on the 5 day Overlay, there is an imbalance of sellers over buyers and on the 10 day overlay, there is again an imbalance of buyers over sellers. What do you do in such scenarios especially when the Net Flow information from the 1 day, 3 day and 5 day overlays are showing conflicting results?
Thanks and remain blessed.....
- Joined May 2009 | Status: Member | 1,879 Posts
Disliked{quote} You know, Mzvega, having read "The three day rule", I thought of how we can we expand this concept intraday - I think, we can do it. For example, we can take the minor timeframe of one hour and see how the 1H market profile is formed, then we add the second hour profile and so on until we can see the balance intraday. How do you think? Best D.P.Ignored
Auction Market Value Analytics(tm) Report
Background
Copyright CISCO 2007
Auction Market Value Analytics (tm)
Successful trading is easy to define when based on value. The breakout (initiative) trader enters on a change of value (a breakout when the market has been balancing) and exits when value stops changing (trend end, start of congestion). The trader of balances (responsive) seeks to close out when value begins changing (trend begins). The key, obviously, is to track value. Value, strictly defined, is constant only in balanced markets. (Imagine a strongly trending market: value is constantly changing and hence is not defined in a measurable way.) Value Analytics(tm) is the quantification of profile and market condition variables, providing the data for finding value The multi-day structure of Value Analytics is based on the discovery that a single day's data is inadequate to define the development of a balanced market condition. The minimum time is of the order of three days.
Value Analytics views the market from a three day perspective. examining the flow of each profile variable over that time frame.
The first step for the serious trader is to understand value. In auction markets, value is an experimental measure: it is what the majority of traders think it is at that point in time. They vote by trading. Often overlooked in profile literature is the fact that value can generally only be found for a market in balance. Balance can be defined only in conjunction with a time frame: a 3 day balance, a 9 day balance, etc. Further, a market can be in a 10 day balance while trending in the 4 day time frame. Hence the beginning of market analysis must be an understanding of the market's condition (balance or imbalance). Value Analytics starts with a measure of market condition on a 2, 3, 5 and 10 day basis.
(D.P. Do you see the conundrum here? It doesn't matter how you slice, dice, or merge the data intraday, AMVA is based on the discovery that a single day's data is inadequate to define the development of a balanced market condition. AMVA all Analysis starts with the market's condition. If you want to trade balance's intraday That is a Market Profile Concept. AMVA concept of a Balance can be defined only in conjunction with a time frame: a 3 day balance, a 9 day balance, etc. AMVA has no need to "bastardize" market profile concepts, Auction Market Value Theory, as with any other theory using empirical research or studies, has what they call "permitted practices". Auction Market Value Theory has its own method as permitted by theory for dealing with intraday balances: Congestive Market Timing: The Run-Pause Profile (TM))
The CBOT Market Profile (1985) manual opened the door to single day value evaluation. Market Profile methodology is propounded more clearly in the CBOT Market Profile Manual (1991) . Auction Market Value Analytics) (AMVA) assumes that the user has at least a rudimentary knowledge of profile concepts and methodology (i.e., form of a profile display (bell curve), point of control, value area, initiative trading, responsive trading, etc.). AMVA integrates longer term Overlay measures, profile methodology and general market principles to find value and other trading reference points as a guide to the development of one's trading strategy (set-up).
Value is continuous and migratory, as one of our bright students noted. Price undergoes constant change (ticks); value change is much more measured. Still, the local value (daily value area) fluctuates even in bounded, balanced markets. If value changes slowly over a period of days (migrates), the upper and lower limits of the balance are adjusted at the end of each day's recalculation and balance is maintained. The balance boundaries may change somewhat. This is value 'creep'. A creeping market remains the province of the responsive trader.
A rapid change in value is evidenced by a price breakout from the established balance limits, with price continuing directionally. In this case the end of day recalculation does not find a balanced market (a trend is underway). Initiative traders work this arena. Obviously, the market's condition determines the appropriate method of attack.
Auction Market Value Analytics starts by identifying balanced market conditions, as stated. AMVA uses timeframes of 1, 2, 3, 5 and 10 days for the balance search. Balances, as they exist, give the information required for entry and exit decisions. The initiative trader is constantly seeking the point where price breaks out (for entry) and once in, immediately turns to looking for signs of congestion (for exit). The responsive trader is active in balanced conditions (selling highs and buying lows). When a (breakout) trend begins, the responsive trader goes to the sidelines. Market condition is thus the arbiter, the first level of analysis. Your knowledge of market condition gives you a broad unbrella for your trading activities: the go, no go signals of balance and imbalance.
As a trader (either responsive or initiative) continues with a trade, the market is changing (continuous and migratory, remember?). Market behavior reflects the collective intent of all participants; the problem lies in divining their intent from the data flow (ticks for the most part) as quickly as possible. Here techniques introduced by Market Profile*, Meta-Profile**, standard market analysis and CISCO research come into play. This second level consists of e.g.: starting with market condition and then comparing price with earlier value (value area or the limits of a balance); volatility change, initial balance behavior, profile value center and change, TPO analyses, etc. Each of the 30 or so reference points in the Value Analytics table have the potential for contributing information about the market's intent. Each profile variable, by itself, rarely dominates. It is the collective that counts. (This is the reason that traders who concentrate on value area alone find a high variability in their trading results.)
Not all reference points are important in any one case. You must learn about each of them and how to discriminate. This is called experience. In some profile teaching the operative word is 'holism', looking into the pot with some 30 or so elements and somehow divining which control the taste today. Value Analytics goes the other way, separating the elements, measuring them and their flow individually and eliminating those that do not apply to the case at hand. Feedback is involved: if your understanding of a particular item (say trade facilitation) is in error and you continually make that error in your market strategy; your error will become apparent to you rather quickly. This illustrates the value of isolating the reference points and examining them individually.
The job of Auction Market Value Analytics is to integrate the two information levels, market condition (Level 1) and individual reference points (Level 2). This provides the trader the most current information available on value and the way it is changing. Both level 1 and level 2 informations are tabulated for the last three days, so that any reference point may be traced and its trajectory determined. These end-of-day data are available about six thirty PM, Chicago time. This gives you the time to do a thorough pre-market analysis the night before (i.e. to develop a trading strategy for the new day). You are also prepared for the after-market, should you wish to trade it.
The trader has two jobs; First is to integrate the latest information (last three days) into a strategy for the coming day. This primarily draws on the Yesterday's Data on the Value Analytics pages. These data provide the flow of the market, where it is headed. The result is a trading strategy for tomorrow. Second is implementation of that strategy in trading tomorrow's market.
Starting about 2 AM, when some of the electronic markets begin generating substantial volume, the Current Day market Value Analytics program offers a current analysis of the market, including it's interaction with the yesterday data list. These data offer an answer to the trader's toughest question, "what is my market doing now (i.e. continuation or not)". An additional tool, 'Run-Pause' analysis, examines congestion on the fly, on 15 and 30 minute scales. From midnight forward the trader can be in touch with the market, including all the information required for trading decisions within his (or her) trading strategy.
* Market Profile is a trademark of the CBOT.
** Meta-Profile is a trademark of CISCO. Meta-Profile methodology is copyrighted.
Auction Market Value Analytics(tm) Report
Background
Copyright CISCO 2007
Continued.....................
Markets are not efficient, rather they are effective - Jones
- Joined May 2009 | Status: Member | 1,879 Posts
Disliked{quote} You know, Mzvega, having read "The three day rule", I thought of how we can we expand this concept intraday - I think, we can do it. For example, we can take the minor timeframe of one hour and see how the 1H market profile is formed, then we add the second hour profile and so on until we can see the balance intraday. How do you think? Best D.P.Ignored
Auction Market Value Analytics(tm) Report
Background
Copyright CISCO 2007
Value Analytics is the culmination of the Market Profile revolution begun by J.Peter Steidlmayer and the Chicago Board of Trade in 1985. Their focus on day value and the dynamics of profile formation had the stated goal of "giving the trader an edge". In the statistical universe of an auction market, even a modest edge can lead to substantial profits in the long run (look at what an 'edge' has done for the statistics based casino business).
As portrayed in the 1985 CBOT Market Profile Manual,Market Profile describes a market that traces out a bell shaped (normal distribution) curve: little trading at the higher and lower prices, with a lot of activity at the middle prices. Value is found as the central 70 percent of the cleared trading volume. Reference points such as day types, range extension and tails are defined. These analyses are based on the CBOT Liquidity Data Bank of cleared price, time and volume. This data bank is unique to the CBOT and the CBOT advertised a product, "The CBOT Market Profile Service is a Detailed Breakdown of Pit Activity on the Exchange Floor. Volume and Price Information...Measured Against Time." Market Profile parameters discussed below were all defined in terms of the CBOT Liquidity Data Bank (LDB) data. Data from the LDB volumes is used to find 'market condition', where 'trend' refers to intra-day behavior.
Market Condition in Value Analytics is based on multi-day (at least 3 days) behavior of the market; resulting in a market that is either in balance (with a well defined upper and lower limit) or one with changing value (a directional market).
Within the LDB framework, the myriads of daily market profile shapes are parsed out and meaning is inferred from their shapes and (cleared) volume. The process is primarily pattern recognition, as is abundantly clear from the many examples in the Manual and the various other Steidlmayer publications. And, of course, it is an end of day process (clearing was completed around 9 PM).
A practical problem for most traders was the limitation of profile concepts to CBOT futures. e.g. Value area is defined in terms of (cleared) volume and the CBOT LDB is the sole source. Indeed, all the profile concepts required the LDB. Not everyone wanted to trade just CBOT futures and CISCO as an information provider to traders quickly saw the need to be able to determine value for non-CBOT markets. This resulted in the development of the Tick-TPO or Meta-Profile from tick data and CISCO published on the concept in 1987 (twice).
Meta-Profile generalized the 'Market Profile' type analyses to all auction markets, with ticks taking the place of cleared volume. The CISCO Overlay Demand Curve (tm) for locating market condition (balance, imbalance) made the leap from day value to longer time-period value.
A follow-on book to the 1985 CBOT Market Profile Manual, by Dalton, Jones and Dalton (Mind Over Markets, 'MOM, 1990'), more clearly organizes the profile field. Although their analyses were mostly on CBOT futures, they did follow the CISCO lead and applied profile analyses to several non-CBOT futures. (MOM, Appendix 1, explains the 'TPO Value-Area Calculation', without attribution to the source, CISCO.) 'MOM', too, is heavy on pattern recognition. And the same is true to an extreme in the new book by the same authors (Markets in Profile, 2007) .
Enter Auction Market Value Analytics (AMVA):
There is much worthwhile in the market insights of the Market Profile publications. The difficulty lies in the required pattern recognition methodology (holism) needed for their application to real world market analysis. Value Analytics is designed to combine the older Market Profile discoveries with the newer Meta-Profile and Market Condition methodology into an analytical technique that results in objective market measurements.
Where pattern recognition provides inferences, Value Analytics offers more solid guideposts. For instance, early termination of an auction (no tail at, say, the low) may tell pattern recognitionists that buyers took over, with the resulting group of potential consequences (e.g. the start of a trend). By comparison, data from Value Analytics fills in the blanks:
1) Is the market in balance?, If yes the Overlay Demand Curves provide
upper and lower limits
and the tail may have little meaning until and unless there is an upside breakout.
2) Is the market growing (increasing range and volume) or slowing? The AMVA trader
can tell by following:
the track of TPO counts, tick counts, the trade facilitation factor, etc.
3) Is a tail incomplete? AMVA gives you quantitative measures of
subsequent behavior.
4) Is the market starting to become directional?, i.e. is price nearing a balance limit?
The Overlay for various timeframes provides an answer.
5) And a 'MOM' favorite, what is the attempted direction? AMVA calculates it.
In the holistic universe of profile pattern recognition a trader must have a very large amount of 'inferential' information, putting together a number of clues into a final diagnosis. If the market does not behave as expected, what part of the whole can be examined to explain the failure? On the other hand, AMVA analysis is built from discrete elements as in the sample data. These elements are put together only at the end of the study. If the analysis proves wrong it is easy to sort out and examine the offending element(s). In fact, as markets change, as some do over time, AMVA data reflects these changes and the trader can make adjustments.
The difference between the two disciplines (pattern recognition and AMVA) is most easy to understand by what is meant by trader self-understanding. Self understanding to the pattern recognitionist includes all the elements of the various patterns, how they interact and the trader's involvement in the process. Self understanding to the AMVA trader is simply a knowledge of the level of risk that trader is comfortable with.
What is Auction Market Value Analytics (AMVA)?
We have made some comparisons between pattern recognition and Value Analytics. In a larger sense AMVA represents market concepts first beginning as ideas and qualitative evaluations being transformed into more measurable, quantitative numbers. The move is from practical observational methodology developed through the genius of Steidlmayer for his own benefit as a trader, to the more analytical format of AMVA that can be applied by any educated trader. AMVA is not a formula, but it distills much of the pattern recognition information into useable numbers for a trader's strategy.
AMVA is the confluence of the early work on profiles by Steidlmayer with the subsequent analytical studies of CISCO. The insights of Steidlmayer broke new ground in the understanding of auction markets. His contribution cannot be diminished. Without his perceptive understanding of the markets from the perspective of being in the pits, there would possibly be no valid auction market analyses today. His intuitive approach developed truths that we believe are better applied by objective analyses to the (non-pit) markets of today. The bell shaped curve concept was critical to the early description of the market. Today we know that a true bell shaped market curve is a rarity. But the concept gave market profile it's original legs (value area). The field began rounding out with the discovery by CISCO that TPOs are valid replacements for the cleared volume of the original profile, for calculating value. That meant that all auction markets, not just the CBOT, could be analyzed. As noted above, CISCO's development of the Overlay Demand Curve identifies a market's condition (balance). Putting it all together has produced a trading tool, AMVA. The AMVA trader can use objective measures to replace much of the intuitive, holistic market profile teaching of today. One thing has not changed. AMVA methodology, like the original CBOT Market Profile , gives the trader an edge, not a certainty.
Auction Market Value Analytics(tm) Report
Background
Copyright CISCO 2007
https://web.archive.org/web/20150208...m/amva_fs.html
Markets are not efficient, rather they are effective - Jones
- Joined May 2009 | Status: Member | 1,879 Posts
Disliked1) How many Reference Points do you use when you derive the Net Flow (ie. "Direction" + "Activity")? Specifically, could you please enumerate the best reference points to include in the calculation of the Net Flow - it appears some of the data is being repeated in different reference points, for example, Q1 TPO, Q2 TPO, Q3 TPO, Q4 TPO, then TPO T (ie TPO Total); Dist#1 UL, Dist#1 LL, etc I am using about 34 Reference Points and I think they are too many and hence giving me spurious results.Ignored
Q1, Q2, Q3, Q4 tpos & Dist#1 UL, Dist#1 LL are not use for Net flow analysis, If you noticed there is not always tpo counts for the Qs or Dist#. TPO counts arent listed per Q , unless the pre-condition of balance (1 dist) is met.
Tops above, below the poc, & total tpos (tpo vol), are daily objective measures regardless of the condition, as you mentioned Q tpo's refs would already be part of the tpoAbv, blw, total regardless of condition (dist 1 or dist>2).
Disliked2) Sometimes I get conflicting Net Flow data/sum and I am usually confused as to which one to use or rely on. For example, I could get Net Flow of -12 on the 1 day Overlay/Profile graphic, whereas the 3 day and 5 day Overlay distributions yield +3 and +7 respectively. Given such a scenario, which one supersedes the others?Ignored
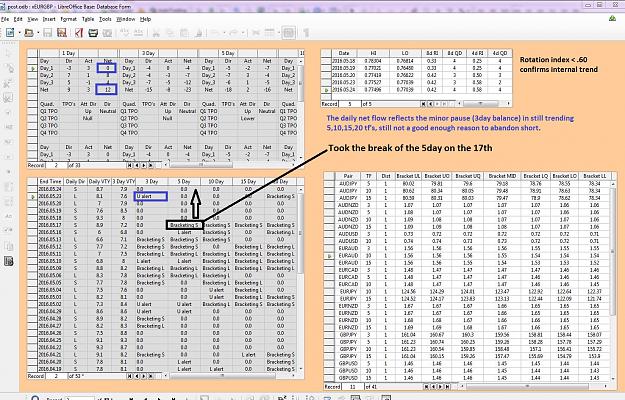
Are you netting the reference points for just a single days data?
We are looking for the "current" trajectory of the market. Since daily value fluctuates even in a bounded 3day market as shown in the 3day rule article. We use data from 3days of daily profile refs. It filters out the daily fluctuation. 1 days worth of market data is an inadequate sample of data that tells you nothing about the condition of the LTF market (i.e. 3day overlay (balance or trend))
In my examples I calculate each day individually. Each day has a net "dir, act, total"
day1
Attached Image (click to enlarge)
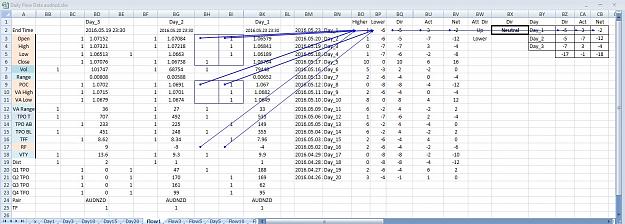
then day2
Attached Image (click to enlarge)
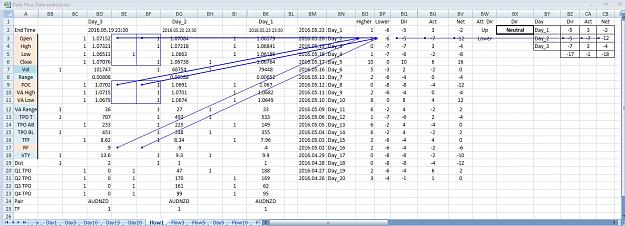
Then day3
Attached Image (click to enlarge)
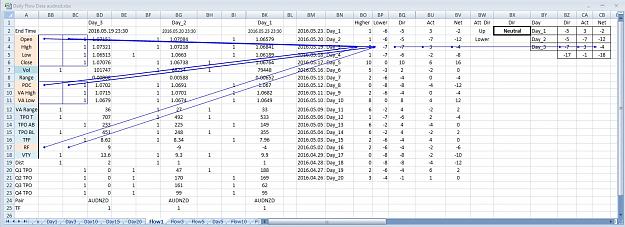
Then you net the 3days of daily net values to get a final "net result". Now you have filtered out the random fluctuations of the intraday tf
Attached Image (click to enlarge)
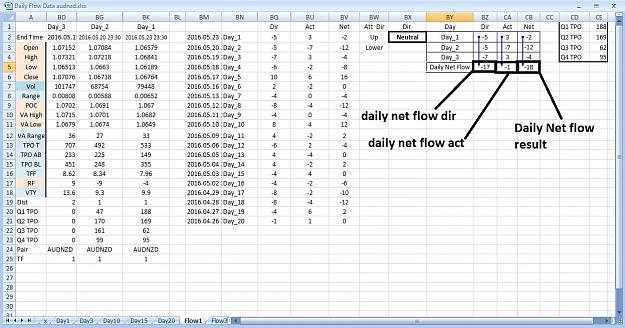
Daily net flow analysis only uses 1 day overlays. Now, however I do calculate net flow on other tfs. Not for trading. I keep the data so if and when I can find the time, I can use a simple "if this" analysis on the data to determine the "figure of merit" (quantitative methodology (Potential/Risk)) for testing if my ideas/methods have enough "merit" worth trading.
Disliked3) I have also observed that many times there is an imbalance of buyers over sellers on the 3 day overlay, whereas on the 5 day Overlay, there is an imbalance of sellers over buyers and on the 10 day overlay, there is again an imbalance of buyers over sellers. What do you do in such scenarios especially when the Net Flow information from the 1 day, 3 day and 5 day overlays are showing conflicting results? Thanks and remain blessed.....Ignored
Here is an extended list. CISCO uses about 30. However, many are optional. Ive showed you the 16 ones I use indicated by color in my examples.
https://web.archive.org/web/20121118...ce_points.html
Markets are not efficient, rather they are effective - Jones
- Joined Mar 2012 | Status: turning probability into profit | 1,550 Posts
Disliked{quote} The multi-day structure of Value Analytics is based on the discovery that a single day's data is inadequate to define the development of a balanced market condition. The minimum time is of the order of three days. Value Analytics views the market from a three day perspective.Ignored
Disliked{quote} D.P. Do you see the conundrum here? It doesn't matter how you slice, dice, or merge the data intraday, AMVA is based on the discovery that a single day's data is inadequate to define the development of a balanced market condition. AMVA all Analysis starts with the market's condition. If you want to trade balance's intraday That is a Market Profile Concept. AMVA concept of a Balance can be defined only in conjunction with a time frame: a 3 day balance, a 9 day balance, etc. AMVA has no need to "bastardize" market profile concepts, Auction...Ignored
Disliked{quote} Each of the 30 or so reference points in the Value Analytics table have the potential for contributing information about the market's intent. Each profile variable, by itself, rarely dominates. It is the collective that counts. (This is the reason that traders who concentrate on value area alone find a high variability in their trading results.)Ignored
Found at https://web.archive.org/web/20121118...ce_points.html
Edited. I have unexpectedly found that I use some of the reference points as well: PTO daily, VAH, VAL, VPOC, IB, IB extensions.
Disliked{quote}Starting about 2 AM, when some of the electronic markets begin generating substantial volume, the Current Day market Value Analytics program offers a current analysis of the market, including it's interaction with the yesterday data list. These data offer an answer to the trader's toughest question, "what is my market doing now (i.e. continuation or not)". An additional tool, 'Run-Pause' analysis, examines congestion on the fly, on 15 and 30 minute scales. From midnight forward the trader can be in touch with the market, including all the...Ignored
Best
D.P.
P.S.
Disliked{quote} A follow-on book to the 1985 CBOT Market Profile Manual, by Dalton, Jones and Dalton (Mind Over Markets, 'MOM, 1990'), more clearly organizes the profile field. Although their analyses were mostly on CBOT futures, they did follow the CISCO lead and applied profile analyses to several non-CBOT futures. (MOM, Appendix 1, explains the 'TPO Value-Area Calculation', without attribution to the source, CISCO.) 'MOM', too, is heavy on pattern recognition. And the same is true to an extreme in the new book by the same authors (Markets in...Ignored
Basical aspects described in these books were taken into consideration for my usage intraday.
However from time to time I am finding myself curious that some pieces of information are still being lost.
It would be interesting to find them...
Hunting High and Low
- Joined May 2009 | Status: Member | 1,879 Posts
"A Pause Alert, by definition, comprises a minimum of three complete TPO's."
"A Pause Alert(tm), PA, occurs within a trading day when three or more TPO periods overlap. This mini-congestion comprises a common price range over an hour and one-half or longer. The utility of a Pause Alert in an active market is that it offers a trader information points for very short timeframe (intra-day) trading decisions."-CISCO
https://web.archive.org/web/20110518...ackground.html
https://web.archive.org/web/20150117...ackground.html
Markets are not efficient, rather they are effective - Jones
- Joined May 2009 | Status: Member | 1,879 Posts
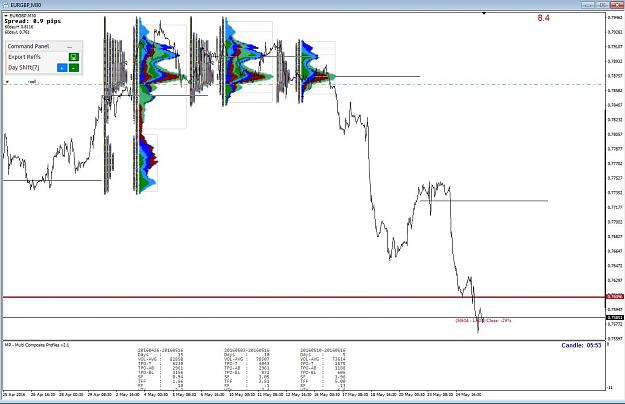
Been holding on to this for a few days........
Attached Image(s) (click to enlarge)
Markets are not efficient, rather they are effective - Jones
QuoteDisliked1) I use 16 at the moment. Those are identified by color on my example sheet (Pink= directional, Blue= activity)
Q1, Q2, Q3, Q4 tpos & Dist#1 UL, Dist#1 LL are not use for Net flow analysis, If you noticed there is not always tpo counts for the Qs or Dist#. TPO counts arent listed per Q , unless the pre-condition of balance (1 dist) is met.
2) "Net Flow of -12 on the 1 day Overlay/Profile graphic"
Are you netting the reference points for just a single days data?If so, I think that may be your problem.
Thanks Mzvega for your clear, illuminating, comprehensive and excellent response - I now understand where I mixed things up a bit....
- Joined May 2009 | Status: Member | 1,879 Posts
Value Analytics (tm): A New Paradigm in Profile Analysis
Donald L. Jones
CISCO Futures
September 10, 2007
Value Analytics combines market condition with market profile reference points to generate data for trading set-ups. Market condition identifies the market environment (balance or trend) within which all trades are made. Condition is the 'external' market, the framework within which all trading takes place. Internal market information comes from profile reference points analyzed as market flow variables, a new and more comprehensive way to find market bias and directionality. The goal continues to be to give a trader the 'edge' that comes from superior market knowledge.
Value Analytics, the Process
Value Analytics (VA) is a melding of the Market Condition analyses developed by CISCO in 1988 (Ref. 1), with a unique form of Market Profile analysis, one oriented to quantitative evaluation of reference points. This is a radical departure from standard market Profile methodology (Ref 2), a move from pattern recognition to analytical evaluation of the profile intra-day markers. The quite substantial differences help bring profile analysis into the province of the ordinary public trader.
Market Condition for Trade Set_up
The market condition part of Value Analytics is little changed from the original. It has always used a balanced market as the base. The balance may be short, a few days or many days or both. Balances are the pause part of the market's characteristic run - pause behavior. Run - pause pairs are seen regularly in time frames as short as an hour or so and as long as many years (e.g. Elliott waves). Market condition is concerned with time frames of a few days to a month. CISCO regularly computes balances of 5, 10, 15 and 20 days nominal length (an entry posted as 10 days can be as short as 6 days). A balance generates the two most important reference points; the upper and lower limits are the support and resistance prices. This information is most important to the initiative trader, one who trades breakouts. If there are several time frames in balance, then the shorter will break out first, followed by the longer, which has wider limits.
Balance limits locate the tops and bottoms for the responsive trader, who sells highs and buys lows. Further, risk levels can be estimated by splitting the limit's range into quadrants, one-quarter from the top, the middle and one-quarter up from the bottom. If you have a balance you can find reasonable trading points whether you are an initiative trader, or responsive or both. What is missing from a market condition set-up described here is any specific information on the internal (between the limits) market situation. All trading points and risks come directly from the geometry of the balance.
Market Profile, Standard Method
Market profile reference points offer information on the internals of the market. Is the trading symmetrical, is volume increasing or decreasing, is the initial balance stable, is the value area changing, etc? Reference points are defined and discussed in the CBOT Market Profile manuals of 1985 and 1991 (Ref 2, 4) and a few other sources such as Mind Over Markets (Ref 5). Those studies tend to focus on the latest day: the initial balance was wide, value area is steady, there was no range extension on the upside, TPO count was smaller above the POC, etc. Pattern recognition of 'Day Types' started the analysis, which ended with a holistic understanding of how the parts all fit together. These data were used to make market set-ups for the next day.
Many traders use parts of profile modeling found in references 2, 4 and 5. Few seem to understand that there are rules covering profile analysis. In part, this may be a result of teaching profile analysis by example. It is counterintuitive to expect to see a problem set example that demonstrates failure. After all, examples are designed to show how a process works, not how it fails. In a complex arena like trading, the existence of some failure is a foregone conclusion. One general rule is that there must be enough trading, liquidity, in the market. How much is enough? There is no exact number, but a market with less that 200 ticks per day is suspect. There must be movement, a market sitting at one price all day gives no information. Another rule applies to a market's condition: balanced markets offer much, much more information than those not in balance. Lastly, a rule in science is that a theory, a proposition, must stand up to independent testing. Value Analytics employs these rules. A set of rules and conditions is listed below. A Value Analytics game permits anyone to test the methodology.
Market Profile Reference Points, Conditions and Rules
1) Market condition is found from the Overlay Demand Curve (Ref 1).
not the one-day LDB methodology of the CBOT Market Profile (Ref 2).
2) Value area comes from the meta-profile TPOs (Ref 3, 3a),
not from cleared volume as in the Market Profile (Ref 2).
3) Day types are not identified. Pattern recognition is little used in Value Analytics.
4) No attempt is made to differentiate between long time-frame and short time-frame traders.
5) Analysis starts from market condition, not with a profile display.
6) Reference points are used as flow variables, not as single day numerics.
7) The market must be free, not controlled by one or a few players.
8) Valid data is assumed: e.g. there must be adequate volume and volatility as well as proper balance.
Preparation
Contrary to normal profile procedure, Value Analytics starts with Market Condition as the framework within which all trading takes place. Profile analysis and reference points play a subsidiary, but often important role, describing the infrastructure of the market, the internal details that identify market flow and market bias. The market is treated as a continuum, a flow through time. Profile variables are analyzed for their change over time. That change can show directionality and market bias, something much harder to do with the absolute numbers used in standard profile analysis.
By quantizing the profile variables, Value Analytics removes much of the mystery of profile trading; the pattern recognition and the holistic evaluation of the motivations of the market's players (Ref 2, 4, 5). Quantized profile data can stand alone. The typical profile trader may well appreciate a profile methodology that is more analytical. However, the synergism of condition and profile together gains much more market information collectively than either can do alone.
Although the positive aspects of Value Analytics analysis are most important in developing trade set-ups, negative information is nearly as important. Item 7 above, on limitations, can be illustrated in the calculation of value area. This reference point is the most widely used and probably most abused of all. A valid value area determination is only possible in a balanced market. That is because the value area is centered about the most actively traded price, the point of control (POC). A trend will usually not have a valid POC, as value is continually changing. Trading on an invalid reference point is worse than flipping a coin. A bad value area may actually point you in the wrong direction.
A Value Analytics Market Set-up
For the test, select the DJ, Sep 2007, September 6. Market condition will come from the last five days Overlay (Ref 1), Figure 1 in the Appendix. From figure 1, the balance limits are 134450 - 132350 as can best be seen from the compressed Overlay. CISCO maintains balance histories on a number of futures. Figure 2 in the Appendix is a sample set for DJ for the Sep 2007 delivery. Table 1 covers the period of the test for the 5 Day Overlay.
Dte Ov F Dl Yr ULIM LLIM CLO $RNG U-OCT MID L-OCT
0823 05 DJ 9 7 S 133200 130000 132610 3200 132800 131600 130400
0830 05 DJ 9 7 L 134100 132000 132790 2100 133838 133050 132262
0831 05 DJ 9 7 S 134400 132100 133640 2300 134113 133250 132387
0904 05 DJ 9 7 S 134400 132100 133640 2300 134113 133250 132387
0905 05 DJ 9 7 S 134400 132300 133430 2100 134138 133350 132562
0906 05 DJ 9 7 S 134400 132300 133780 2100 134138 133350 132562
0911 05 DJ 9 7 S 134000 130700 133210 3300 133588 132350 131112
0912 05 DJ 9 7 S 134000 130700 133300 3300 133588 132350 131112
Table 1. Table of Balances
Identifying the Market Condition Trading Regions
Upper Limit: ULIM: Octant may be used for risk control
.... Above ULIM is the initiative (long) trading (breakout) region
.... Below ULIM and above Middle is for responsive shorting
Lower Limit: LLIM: Octant may be used for risk control
.... Below LLIM is the initiative (short) trading (breakout) region
.... Above LLIM and below Middle is for responsive buying
This is a preliminary set-up based entirely on units set by the market
itself. If longer time-frames are in balance, as they are (see Market
Condition Balances in the Appendix), then you may have a series of breakout
levels and a series of responsive trading points. For simplicity, we stick
with only the 5 Day balance here.
Analysis of Reference Points
At end-of-day, Value Analytics creates a set of approximately 30 reference
points for each of the past three days. In most cases only about half are
required to understand what the market internal directionality and bias might be.
The full VA table is in figure 3 of the Appendix. Table 2 contains the set used
in this analysis.
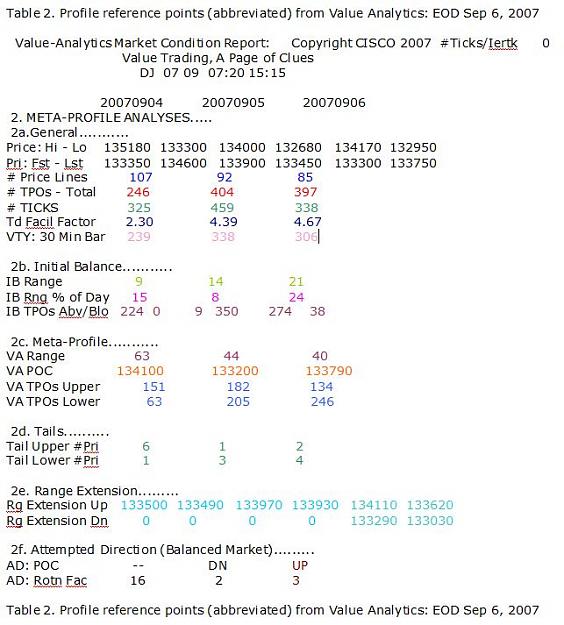
Profile Reference Points Internal Market Information
.... There are over 30 reference points in the Report Table in the Appendix: We selected the
ones below; you could use others as well.
In fact, you are encouraged refer to the CBOT Profile Manual, 1991 to review the reference points.
Here is our read on the market internals.
.... 1) Price lines: number decreasing (107, 92, 85): Market activity decreasing
.... 2) TPOs count: increasing (246, 404, 307): Market activity increasing
.... 3) Ticks count: about flat (325, 459, 338): Market activity no call
.... 4) Trade Facilitation: increasing,(2.30, 4.39, 4.67) market allowing less trading
.... 5) Volatility increasing (239, 338, 306): market opportunity increasing
.... 6) Initial Balance range increasing (9, 14, 21): more control in professional hands
.... 7) Initial Balance % increasing (15, 8, 24): confirms more control in professional hands
.... 8) Initial Balance TPOs below is large: Directional down
.... 9) Value Area range narrow (63, 44, 40): stabilizing activity
.... 10) Point of Control is stable (134100, 133200, 133790): little movement in value
.... 11) TPOs are unbalanced to the bottom: expect more trading above POC
.... 12) Tails above and below both show completed auctions: argues for continued balance
.... 13) Range Extension both up and down: confirms balance
.... 14) Attempted direction, both up: argues for directional up market
Summing up the Reference Points
Votes for a quieter market: 9 (1, 3, 4, 6, 7, 9, 10, 12, 13)
Votes for more activity: 2 (2, 5)
Votes for directional up: 2 (11, 14)
Votes for directional down: 1 (8)
The reference points show little directionality; mostly a quiet market. A
pure profile trader would have little set-up material since the reference
points are rather non-committal.
A Value Analytics trader also has little guidance from the profile reference
points in this case; but still has quite a lot of information from the market
condition trading points.
References
References
1. Overlay Detection of Long Term Market Condition, Donald L. Jones, Profile Report, Oct 12, 1988
2. CBOT Market Profile Manual 1985 CBOT Market Profile 1985, Key Words
3. Determining the TPO Value Area, Don Jones, The Alumni Letter, Market Logic School, V1, #3 Ap 13, 1987
3a. Estimating the Market Profile Value Area for Intraday Trading, Donald L. Jones, Technical Analysis, Sep 1987
4. CBOT Market Profile Manual 1991 Download from CMEGroup: Note: Large Book: Wait for Download.
CBOT Mkt Prof 1991
4a. CBOT Market Profile Manual 1991 Key Words
CBOT Market Profile 1991, Key Words
5. Mind Over Markets, Dalton,J., Jones,E., Dalton,R., 1990
6. The Market Unit, Jones, D.L., Mar 17, 2005 CISCO References Page The Market Unit
https://web.archive.org/web/20121228...analytics.html
Donald L. Jones
CISCO Futures
September 10, 2007
Value Analytics combines market condition with market profile reference points to generate data for trading set-ups. Market condition identifies the market environment (balance or trend) within which all trades are made. Condition is the 'external' market, the framework within which all trading takes place. Internal market information comes from profile reference points analyzed as market flow variables, a new and more comprehensive way to find market bias and directionality. The goal continues to be to give a trader the 'edge' that comes from superior market knowledge.
Value Analytics, the Process
Value Analytics (VA) is a melding of the Market Condition analyses developed by CISCO in 1988 (Ref. 1), with a unique form of Market Profile analysis, one oriented to quantitative evaluation of reference points. This is a radical departure from standard market Profile methodology (Ref 2), a move from pattern recognition to analytical evaluation of the profile intra-day markers. The quite substantial differences help bring profile analysis into the province of the ordinary public trader.
Market Condition for Trade Set_up
The market condition part of Value Analytics is little changed from the original. It has always used a balanced market as the base. The balance may be short, a few days or many days or both. Balances are the pause part of the market's characteristic run - pause behavior. Run - pause pairs are seen regularly in time frames as short as an hour or so and as long as many years (e.g. Elliott waves). Market condition is concerned with time frames of a few days to a month. CISCO regularly computes balances of 5, 10, 15 and 20 days nominal length (an entry posted as 10 days can be as short as 6 days). A balance generates the two most important reference points; the upper and lower limits are the support and resistance prices. This information is most important to the initiative trader, one who trades breakouts. If there are several time frames in balance, then the shorter will break out first, followed by the longer, which has wider limits.
Balance limits locate the tops and bottoms for the responsive trader, who sells highs and buys lows. Further, risk levels can be estimated by splitting the limit's range into quadrants, one-quarter from the top, the middle and one-quarter up from the bottom. If you have a balance you can find reasonable trading points whether you are an initiative trader, or responsive or both. What is missing from a market condition set-up described here is any specific information on the internal (between the limits) market situation. All trading points and risks come directly from the geometry of the balance.
Market Profile, Standard Method
Market profile reference points offer information on the internals of the market. Is the trading symmetrical, is volume increasing or decreasing, is the initial balance stable, is the value area changing, etc? Reference points are defined and discussed in the CBOT Market Profile manuals of 1985 and 1991 (Ref 2, 4) and a few other sources such as Mind Over Markets (Ref 5). Those studies tend to focus on the latest day: the initial balance was wide, value area is steady, there was no range extension on the upside, TPO count was smaller above the POC, etc. Pattern recognition of 'Day Types' started the analysis, which ended with a holistic understanding of how the parts all fit together. These data were used to make market set-ups for the next day.
Many traders use parts of profile modeling found in references 2, 4 and 5. Few seem to understand that there are rules covering profile analysis. In part, this may be a result of teaching profile analysis by example. It is counterintuitive to expect to see a problem set example that demonstrates failure. After all, examples are designed to show how a process works, not how it fails. In a complex arena like trading, the existence of some failure is a foregone conclusion. One general rule is that there must be enough trading, liquidity, in the market. How much is enough? There is no exact number, but a market with less that 200 ticks per day is suspect. There must be movement, a market sitting at one price all day gives no information. Another rule applies to a market's condition: balanced markets offer much, much more information than those not in balance. Lastly, a rule in science is that a theory, a proposition, must stand up to independent testing. Value Analytics employs these rules. A set of rules and conditions is listed below. A Value Analytics game permits anyone to test the methodology.
Market Profile Reference Points, Conditions and Rules
1) Market condition is found from the Overlay Demand Curve (Ref 1).
not the one-day LDB methodology of the CBOT Market Profile (Ref 2).
2) Value area comes from the meta-profile TPOs (Ref 3, 3a),
not from cleared volume as in the Market Profile (Ref 2).
3) Day types are not identified. Pattern recognition is little used in Value Analytics.
4) No attempt is made to differentiate between long time-frame and short time-frame traders.
5) Analysis starts from market condition, not with a profile display.
6) Reference points are used as flow variables, not as single day numerics.
7) The market must be free, not controlled by one or a few players.
8) Valid data is assumed: e.g. there must be adequate volume and volatility as well as proper balance.
Preparation
Contrary to normal profile procedure, Value Analytics starts with Market Condition as the framework within which all trading takes place. Profile analysis and reference points play a subsidiary, but often important role, describing the infrastructure of the market, the internal details that identify market flow and market bias. The market is treated as a continuum, a flow through time. Profile variables are analyzed for their change over time. That change can show directionality and market bias, something much harder to do with the absolute numbers used in standard profile analysis.
By quantizing the profile variables, Value Analytics removes much of the mystery of profile trading; the pattern recognition and the holistic evaluation of the motivations of the market's players (Ref 2, 4, 5). Quantized profile data can stand alone. The typical profile trader may well appreciate a profile methodology that is more analytical. However, the synergism of condition and profile together gains much more market information collectively than either can do alone.
Although the positive aspects of Value Analytics analysis are most important in developing trade set-ups, negative information is nearly as important. Item 7 above, on limitations, can be illustrated in the calculation of value area. This reference point is the most widely used and probably most abused of all. A valid value area determination is only possible in a balanced market. That is because the value area is centered about the most actively traded price, the point of control (POC). A trend will usually not have a valid POC, as value is continually changing. Trading on an invalid reference point is worse than flipping a coin. A bad value area may actually point you in the wrong direction.
A Value Analytics Market Set-up
For the test, select the DJ, Sep 2007, September 6. Market condition will come from the last five days Overlay (Ref 1), Figure 1 in the Appendix. From figure 1, the balance limits are 134450 - 132350 as can best be seen from the compressed Overlay. CISCO maintains balance histories on a number of futures. Figure 2 in the Appendix is a sample set for DJ for the Sep 2007 delivery. Table 1 covers the period of the test for the 5 Day Overlay.
Dte Ov F Dl Yr ULIM LLIM CLO $RNG U-OCT MID L-OCT
0823 05 DJ 9 7 S 133200 130000 132610 3200 132800 131600 130400
0830 05 DJ 9 7 L 134100 132000 132790 2100 133838 133050 132262
0831 05 DJ 9 7 S 134400 132100 133640 2300 134113 133250 132387
0904 05 DJ 9 7 S 134400 132100 133640 2300 134113 133250 132387
0905 05 DJ 9 7 S 134400 132300 133430 2100 134138 133350 132562
0906 05 DJ 9 7 S 134400 132300 133780 2100 134138 133350 132562
0911 05 DJ 9 7 S 134000 130700 133210 3300 133588 132350 131112
0912 05 DJ 9 7 S 134000 130700 133300 3300 133588 132350 131112
Table 1. Table of Balances
Identifying the Market Condition Trading Regions
Upper Limit: ULIM: Octant may be used for risk control
.... Above ULIM is the initiative (long) trading (breakout) region
.... Below ULIM and above Middle is for responsive shorting
Lower Limit: LLIM: Octant may be used for risk control
.... Below LLIM is the initiative (short) trading (breakout) region
.... Above LLIM and below Middle is for responsive buying
This is a preliminary set-up based entirely on units set by the market
itself. If longer time-frames are in balance, as they are (see Market
Condition Balances in the Appendix), then you may have a series of breakout
levels and a series of responsive trading points. For simplicity, we stick
with only the 5 Day balance here.
Analysis of Reference Points
At end-of-day, Value Analytics creates a set of approximately 30 reference
points for each of the past three days. In most cases only about half are
required to understand what the market internal directionality and bias might be.
The full VA table is in figure 3 of the Appendix. Table 2 contains the set used
in this analysis.
Attached Image (click to enlarge)
Profile Reference Points Internal Market Information
.... There are over 30 reference points in the Report Table in the Appendix: We selected the
ones below; you could use others as well.
In fact, you are encouraged refer to the CBOT Profile Manual, 1991 to review the reference points.
Here is our read on the market internals.
.... 1) Price lines: number decreasing (107, 92, 85): Market activity decreasing
.... 2) TPOs count: increasing (246, 404, 307): Market activity increasing
.... 3) Ticks count: about flat (325, 459, 338): Market activity no call
.... 4) Trade Facilitation: increasing,(2.30, 4.39, 4.67) market allowing less trading
.... 5) Volatility increasing (239, 338, 306): market opportunity increasing
.... 6) Initial Balance range increasing (9, 14, 21): more control in professional hands
.... 7) Initial Balance % increasing (15, 8, 24): confirms more control in professional hands
.... 8) Initial Balance TPOs below is large: Directional down
.... 9) Value Area range narrow (63, 44, 40): stabilizing activity
.... 10) Point of Control is stable (134100, 133200, 133790): little movement in value
.... 11) TPOs are unbalanced to the bottom: expect more trading above POC
.... 12) Tails above and below both show completed auctions: argues for continued balance
.... 13) Range Extension both up and down: confirms balance
.... 14) Attempted direction, both up: argues for directional up market
Summing up the Reference Points
Votes for a quieter market: 9 (1, 3, 4, 6, 7, 9, 10, 12, 13)
Votes for more activity: 2 (2, 5)
Votes for directional up: 2 (11, 14)
Votes for directional down: 1 (8)
The reference points show little directionality; mostly a quiet market. A
pure profile trader would have little set-up material since the reference
points are rather non-committal.
A Value Analytics trader also has little guidance from the profile reference
points in this case; but still has quite a lot of information from the market
condition trading points.
References
References
1. Overlay Detection of Long Term Market Condition, Donald L. Jones, Profile Report, Oct 12, 1988
2. CBOT Market Profile Manual 1985 CBOT Market Profile 1985, Key Words
3. Determining the TPO Value Area, Don Jones, The Alumni Letter, Market Logic School, V1, #3 Ap 13, 1987
3a. Estimating the Market Profile Value Area for Intraday Trading, Donald L. Jones, Technical Analysis, Sep 1987
4. CBOT Market Profile Manual 1991 Download from CMEGroup: Note: Large Book: Wait for Download.
CBOT Mkt Prof 1991
4a. CBOT Market Profile Manual 1991 Key Words
CBOT Market Profile 1991, Key Words
5. Mind Over Markets, Dalton,J., Jones,E., Dalton,R., 1990
6. The Market Unit, Jones, D.L., Mar 17, 2005 CISCO References Page The Market Unit
https://web.archive.org/web/20121228...analytics.html
Markets are not efficient, rather they are effective - Jones
- Joined May 2009 | Status: Member | 1,879 Posts
Auction Market Value Analytics(tm) Game
Teaching Yourself Profile Trading
CISCO Futures Copyright 2007
Since the beginning of the CBOT Market Profile(tm) product in 1985 the promise of true value based trading has remained attractive but elusive. The major difficulty comes in recognizing market situations as they are developing, using pattern recognition. To help, the basic source of Market Profile (CBOT Market Profile, 1991) identifies four major day types or patterns. The most widely read source (Mind Over Markets) lists nine day types. Day types are made from individual reference points (TPO's, time, etc.) put together in a profile with recognizable characteristics; such as a double distribution day (two humps) or the triplet neutral, neutral-center and neutral-extreme. Since markets develop in many, many ways there can be more day types than the 30 or so reference points. A reference point is somewhat akin to the 'indicator' of technical analysis. There is a substantial difference: a reference point is closely tied to something real and observable in the market; whereas an indicator is the result of a computation--typically from a moving average related process, removed from observation.
A hard look at pattern recognition leads to the suspicion that it is not quantifiable. Each reference point carries it's own type of information. The information from reference point 1 may or may not be equatable to the information in reference point 2, although each is telling you something about the market. Some reference points are clearer than others; a tail is very clear, a day type is often not clear at all. Stirring all reference points into the pot makes it difficult to reach a measurable outcome (in a quantitative sense). Indeed, this has been the experience of most traders. Many have felt that there has to be a better way if traders are to gain the obvious benefits of market value analysis.
The better way, we feel, is to focus on each reference individually. Understand it, and then put each one in context, relative to the others. Starting at the beginning: There are 30 or so reference points. Each reference point contains unique information about the market. Value area points to value, tails at the extremes of a profile distribution indicate whether an auction has completed, day-to-day volume differentials point to increasing or decreasing participation and so on for each of the reference points. Each can tell you something about a market. If you track a reference point, e.g. volume, over the last several days you can see how it is moving, it's flow. You now have a flow variable. You not only have the latest day's volume, but also the direction it is moving. Do the same for the other reference points and in a one-page table you have captured the substance of that market. No set of patterns to memorize, no holistic grouping, just some simple flow variables that you can understand. This is Value Analytics.
Auction Market Value Analytics (AMVA) was created as an analytical, measurements based, approach that puts value trading technology within the reach of all traders. Even before AMVA beta testing was complete it had become clear that many who professed to be 'profile traders were poorly prepared on the profile side. These people use certain elements of profiles, such as value area, to help guide their trading. Many do not know that there are many situations where profile variables do not give the correct information, e.g. value area can always be computed, but there are times when it is misleading or just plain wrong, e.g. when calculated from data in a trend.
The Game
From our Value Analytics experience was born the idea of a profile tutorial, A game format where the trader competes against the market and learns from the experience. The trader is actually doing an apprenticeship. To make it work requires 1) daily Value Analytics data over an adequate time frame, and 2) market condition over the same timeframe. Fortunately, CISCO has a wealth of historical market condition data broken down by 5, 10, 15 and 20 day balances. We also have created historical Value Analytics profile data. these profile and Overlay data fuel such a trading game, permitting the examination of hundreds of trades.
The Game is for a player to choose a desired day, analyze it with Overlay and profile methodology (Value Analytics), ending up with a good enough understanding of the market to formulate a trading plan for the next day. This will typically lead to finding at least four significant price markers: upside breakout, downside breakout (for trend initiation) and the upper responsive short and lower responsive long (in a congesting market). You also must determine two risks, one for breakout trading, one for responsive trading. The trading risk you accept has two inputs: market risk tied to volatility and the (personal) risk that fits your trading personality. Once you have in hand the market trading points and the risk(s) you are willing to take you have a trading strategy for the next day. This is your 'set up'.
Now you know what you will do if the market hits your points. Then you trade the next day with the real time profile builder , tracking the profile development just as is one does regularly when trading the current day. This is the Game. The market, in its normal run pause behavior, offers you opportunity. How well you handle that opportunity is your score.
On a given day the test market traded may have had a breakout, a run up to continue the trend for a while, then a pause and finally a return back to balance. you, of course, do not know this until you have run the Game for that day. The potential of that market move is the range from the breakout price to the price at the top of the run. Your score is the amount your strategy would have collected as a percentage of the market's potential.
If, on average, you do 40 percent, you are a credible trader. But there are cases where your skill can bring you returns in excess of 100 percent. Such cases are what traders live for, the money and the bragging rights. These exceptional opportunities are really not rare. One such case occurred during the 30 day Value Analytics beta test. Profile Game Example: UU Jun 20, 2007
Developing Your Background in Profiles
Learning comes from playing the Game in many different market situations. In your conduct of the Game, questions may arise about the definitions and applications of some of the profile reference points. As a part of the Game CISCO has built a set of reference tables for the published sources of profile information. This set, the Lookup Publications lists keywords and their page locations. For instance: If you are not clear on the definition of TPO, go to Lookup Publications, find a source (e.g. CBOT Market Profile Manual) and you will see a list of key words. Search for 'TPO' and voila, there it is on page 11. Now you can go to your copy of CBOT Market Profile (it is free to download on the CBOT site) and get a complete description. This sort of directed research accelerates your learning about profile reference points (that is the goal of this tutorial).
Steps
To play the Game: First do your homework after the close: items 1 - 6
1. Select a date from Overlay History table. You will generally play with balance days.
2. Get the Value Analytics Reports for that day.
3. Read the Report Table for the three day flow of the profile variables.
4. Consult the other Tables (3 day Overlay, 2 day Overlay and the profile as needed.
5. Tally the profile variables to find directionality, tendency to change, etc.
6. Develop your strategy: risk, entry points, contingencies.
7. Next (trading) day: Use History to follow the market (30 and/or 15 min basis).
8. Calculate your score.
https://web.archive.org/web/20071105..._mainpage.HTML
Auction Market Value Analytics(tm) Game
Teaching Yourself Profile Trading
CISCO Futures Copyright 2007
Teaching Yourself Profile Trading
CISCO Futures Copyright 2007
Since the beginning of the CBOT Market Profile(tm) product in 1985 the promise of true value based trading has remained attractive but elusive. The major difficulty comes in recognizing market situations as they are developing, using pattern recognition. To help, the basic source of Market Profile (CBOT Market Profile, 1991) identifies four major day types or patterns. The most widely read source (Mind Over Markets) lists nine day types. Day types are made from individual reference points (TPO's, time, etc.) put together in a profile with recognizable characteristics; such as a double distribution day (two humps) or the triplet neutral, neutral-center and neutral-extreme. Since markets develop in many, many ways there can be more day types than the 30 or so reference points. A reference point is somewhat akin to the 'indicator' of technical analysis. There is a substantial difference: a reference point is closely tied to something real and observable in the market; whereas an indicator is the result of a computation--typically from a moving average related process, removed from observation.
A hard look at pattern recognition leads to the suspicion that it is not quantifiable. Each reference point carries it's own type of information. The information from reference point 1 may or may not be equatable to the information in reference point 2, although each is telling you something about the market. Some reference points are clearer than others; a tail is very clear, a day type is often not clear at all. Stirring all reference points into the pot makes it difficult to reach a measurable outcome (in a quantitative sense). Indeed, this has been the experience of most traders. Many have felt that there has to be a better way if traders are to gain the obvious benefits of market value analysis.
The better way, we feel, is to focus on each reference individually. Understand it, and then put each one in context, relative to the others. Starting at the beginning: There are 30 or so reference points. Each reference point contains unique information about the market. Value area points to value, tails at the extremes of a profile distribution indicate whether an auction has completed, day-to-day volume differentials point to increasing or decreasing participation and so on for each of the reference points. Each can tell you something about a market. If you track a reference point, e.g. volume, over the last several days you can see how it is moving, it's flow. You now have a flow variable. You not only have the latest day's volume, but also the direction it is moving. Do the same for the other reference points and in a one-page table you have captured the substance of that market. No set of patterns to memorize, no holistic grouping, just some simple flow variables that you can understand. This is Value Analytics.
Auction Market Value Analytics (AMVA) was created as an analytical, measurements based, approach that puts value trading technology within the reach of all traders. Even before AMVA beta testing was complete it had become clear that many who professed to be 'profile traders were poorly prepared on the profile side. These people use certain elements of profiles, such as value area, to help guide their trading. Many do not know that there are many situations where profile variables do not give the correct information, e.g. value area can always be computed, but there are times when it is misleading or just plain wrong, e.g. when calculated from data in a trend.
The Game
From our Value Analytics experience was born the idea of a profile tutorial, A game format where the trader competes against the market and learns from the experience. The trader is actually doing an apprenticeship. To make it work requires 1) daily Value Analytics data over an adequate time frame, and 2) market condition over the same timeframe. Fortunately, CISCO has a wealth of historical market condition data broken down by 5, 10, 15 and 20 day balances. We also have created historical Value Analytics profile data. these profile and Overlay data fuel such a trading game, permitting the examination of hundreds of trades.
The Game is for a player to choose a desired day, analyze it with Overlay and profile methodology (Value Analytics), ending up with a good enough understanding of the market to formulate a trading plan for the next day. This will typically lead to finding at least four significant price markers: upside breakout, downside breakout (for trend initiation) and the upper responsive short and lower responsive long (in a congesting market). You also must determine two risks, one for breakout trading, one for responsive trading. The trading risk you accept has two inputs: market risk tied to volatility and the (personal) risk that fits your trading personality. Once you have in hand the market trading points and the risk(s) you are willing to take you have a trading strategy for the next day. This is your 'set up'.
Now you know what you will do if the market hits your points. Then you trade the next day with the real time profile builder , tracking the profile development just as is one does regularly when trading the current day. This is the Game. The market, in its normal run pause behavior, offers you opportunity. How well you handle that opportunity is your score.
On a given day the test market traded may have had a breakout, a run up to continue the trend for a while, then a pause and finally a return back to balance. you, of course, do not know this until you have run the Game for that day. The potential of that market move is the range from the breakout price to the price at the top of the run. Your score is the amount your strategy would have collected as a percentage of the market's potential.
If, on average, you do 40 percent, you are a credible trader. But there are cases where your skill can bring you returns in excess of 100 percent. Such cases are what traders live for, the money and the bragging rights. These exceptional opportunities are really not rare. One such case occurred during the 30 day Value Analytics beta test. Profile Game Example: UU Jun 20, 2007
Developing Your Background in Profiles
Learning comes from playing the Game in many different market situations. In your conduct of the Game, questions may arise about the definitions and applications of some of the profile reference points. As a part of the Game CISCO has built a set of reference tables for the published sources of profile information. This set, the Lookup Publications lists keywords and their page locations. For instance: If you are not clear on the definition of TPO, go to Lookup Publications, find a source (e.g. CBOT Market Profile Manual) and you will see a list of key words. Search for 'TPO' and voila, there it is on page 11. Now you can go to your copy of CBOT Market Profile (it is free to download on the CBOT site) and get a complete description. This sort of directed research accelerates your learning about profile reference points (that is the goal of this tutorial).
Steps
To play the Game: First do your homework after the close: items 1 - 6
1. Select a date from Overlay History table. You will generally play with balance days.
2. Get the Value Analytics Reports for that day.
3. Read the Report Table for the three day flow of the profile variables.
4. Consult the other Tables (3 day Overlay, 2 day Overlay and the profile as needed.
5. Tally the profile variables to find directionality, tendency to change, etc.
6. Develop your strategy: risk, entry points, contingencies.
7. Next (trading) day: Use History to follow the market (30 and/or 15 min basis).
8. Calculate your score.
https://web.archive.org/web/20071105..._mainpage.HTML
Auction Market Value Analytics(tm) Game
Teaching Yourself Profile Trading
CISCO Futures Copyright 2007
Markets are not efficient, rather they are effective - Jones
- Joined Mar 2012 | Status: turning probability into profit | 1,550 Posts
Hello Mzvega
I have carefully studied those links you gave me and found some thoughts helpful for my usage.
In particular, at https://web.archive.org/web/20150110...ackground.html
the methodology described might be used as an additional timing tool.
@Run-Pause Profile (TM)/Congestion Profile (TM). The Run-Pause Profile is designed to give the day trader a here-and-now intra-day reading of the short term market condition (intent). It can be a sensitive market timer for the day trader who understands profile concepts. The method begins a day by assuming a congesting market on the time frame the customer has chosen (say, 10 or 15 minutes are the permitted selections). It then sets a congestion-range price target. If the target is exceeded within the first four time periods, non-congestion is assumed and the search for congestion is restarted. So 40 minutes is the length of time considered to be a completed congestion profile for the 10 minute time frame.
@Run-Pause Profile gives you the market timing for your strategy. A somewhat longer term view would come from the 10 minute timeframe. You are able to monitor market changes on very small timeframes within a trading day, observing intent as it develops. The prediction comes from the fact that congesting markets tend to continue in that state, non-congesting markets tend to continue their flow.
@There be no trading within a timeframe (10 or 15 minutes), that timeframe is completely excluded from the analysis.
These theses are the most interesting for me.
However, I have something to discuss.
@It then sets a congestion-range price target.
Do I right undestand that the current 10 min bar is taken as the base bar (concluded from the said above), then we spread its range to both directions and say that we are about to watch for any limits to be hit in the time frameworks of the forthcoming four bars? If so, @non-congestion is assumed and the search for congestion is restarted.
Best
D.P.
Hunting High and Low
- Joined May 2009 | Status: Member | 1,879 Posts
DislikedDo I right undestand that the current 10 min bar is taken as the base bar (concluded from the said above), then we spread its range to both directions and say that we are about to watch for any limits to be hit in the time frameworks of the forthcoming four bars? If so, @non-congestion is assumed and the search for congestion is restarted. Best D.P.Ignored
What it sounds like you are describing is just another form of technical analysis. Its sounds like its "projecting" a range. We want to use actual price time events set by the market itself. Not a computation(removed from observation) projected on to price.
TA and bar charts are non permitted practices in AMVT.
TA uses trendlines on the High & lows of a bar chart to mark areas of congestion.
A Pause Alert, by definition, comprises a minimum of three complete TPO's. Not candlesticks (bars). These are found inside the bars they mark "price and the time of occurrence". Candlesticks are 1 dimensional linear data marked by highs & Lows. TPO's are "price time events" inside the bar's. They are 2 dimensional, they contain elements of both price and time.
This is an example of TA using trendlines as S&R using the high & low of a congested area
Attached Image (click to enlarge)
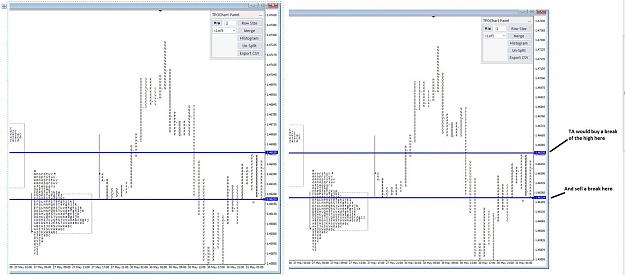
A Pause Alert, by definition, comprises a minimum of three complete TPO's
A Pause Alert(tm), PA, occurs within a trading day when three or more TPO periods overlap
Attached Image (click to enlarge)
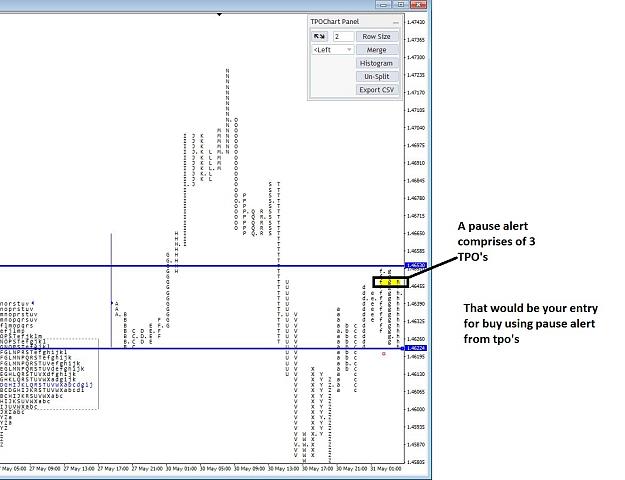
A buy entry from the pause alert (3 tpo's) is a better timed entry than S&R using bar chart
Attached Image (click to enlarge)
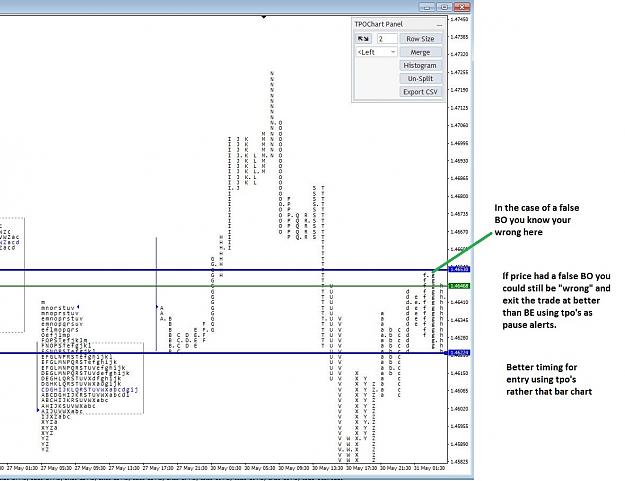
Same thing for a 3 tpo pause alert sell entry
Attached Image (click to enlarge)
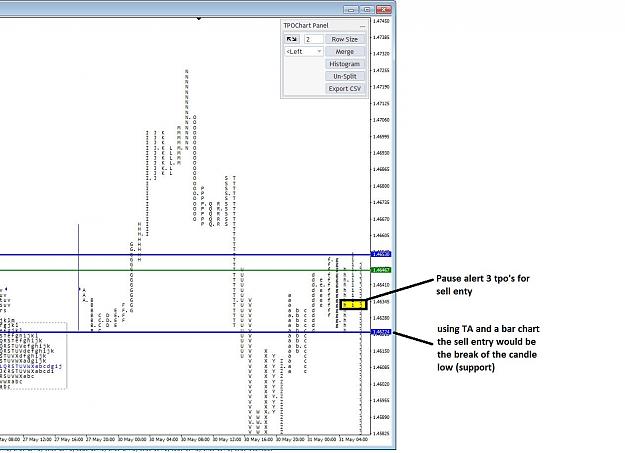
Attached Image (click to enlarge)
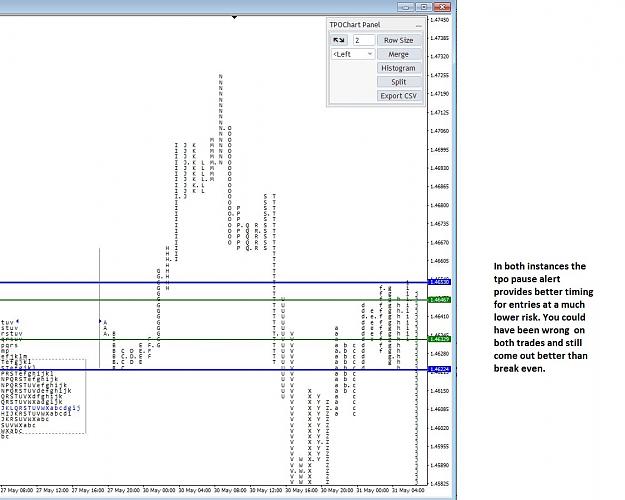
Same chart but with profile removed
Attached Image (click to enlarge)
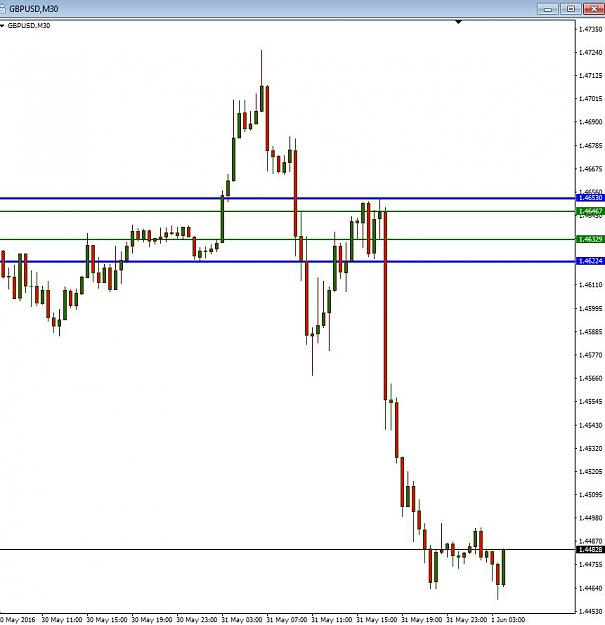
Markets are not efficient, rather they are effective - Jones
- Joined May 2009 | Status: Member | 1,879 Posts
DislikedDo I right undestand that the current 10 min bar is taken as the base bar (concluded from the said above), then we spread its range to both directions and say that we are about to watch for any limits to be hit in the time frameworks of the forthcoming four bars? If so, @non-congestion is assumed and the search for congestion is restarted. Best D.P.Ignored
Attached Image(s) (click to enlarge)
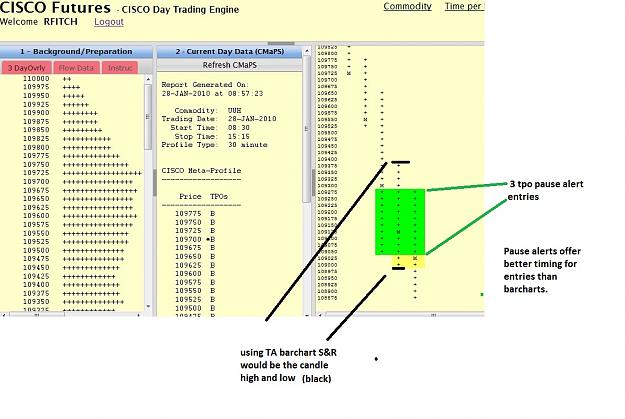
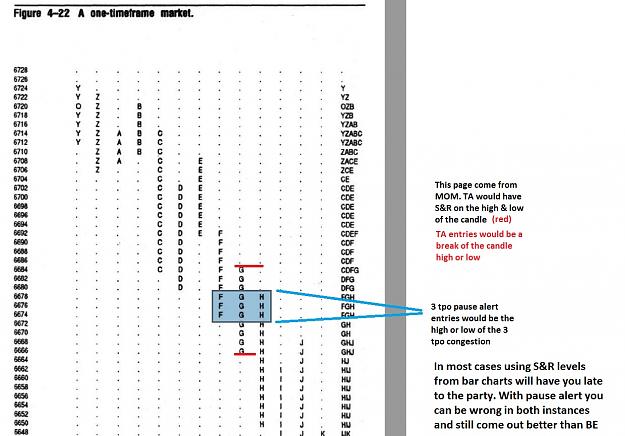
Markets are not efficient, rather they are effective - Jones