• Home
  • Forums
  • Trades
  • News
  • Calendar
  • Market
  • Brokers
  • Login
  • Join
  • User/Email: Password:
  • 4:51am
Menu
  • Forums
  • Trades
  • News
  • Calendar
  • Market
  • Brokers
  • Login
  • Join
  • 4:51am
Sister Sites
  • Metals Mine
  • Energy EXCH
  • Crypto Craft

Options

Bookmark Thread

First Page First Unread Last Page Last Post

Print Thread

Similar Threads

Ichimoku Kinko Hyo EA v1.1 114 replies

Ichimoku Kinko Hyo 198 replies

Ichimoku Kinko Hyo analysis and the "one glance on a single chart" 35 replies

Ichimoku Kinko Hyo: Does it repaint? 2 replies

Ichimoku Kinko Hyo Test 2 replies

  • Trading Systems
  • /
  • Reply to Thread
  • Subscribe
  • 185
Attachments: Ichimoku Kinko Hyo
Exit Attachments
Tags: Ichimoku Kinko Hyo
Cancel

Ichimoku Kinko Hyo

  • Last Post
  •  
  • Page 1 23456 16
  • Page 1 234 16
  •  
  • Poll

  • Ichimoku parameter survey
  •  
  •  
  •  
  •  
  • Post #1
  • Quote
  • First Post: Edited Oct 15, 2014 10:02pm Apr 5, 2014 1:58am | Edited Oct 15, 2014 10:02pm
  •  MetaSecret
  • | Joined Mar 2014 | Status: Member | 184 Posts
Introduction

Ichimoku Kinko Hyo usually just called ichimoku is a technical analysis method that builds on candlestick charting to improve the accuracy of forecast price moves. It was developed in the late 1930s by Goichi Hosoda, a Japanese journalist who used to be known as Ichimoku Sanjin, which can be translated as "what a man in the mountain sees". He spent thirty years perfecting the technique before releasing his findings to the general public in the late 1960s.

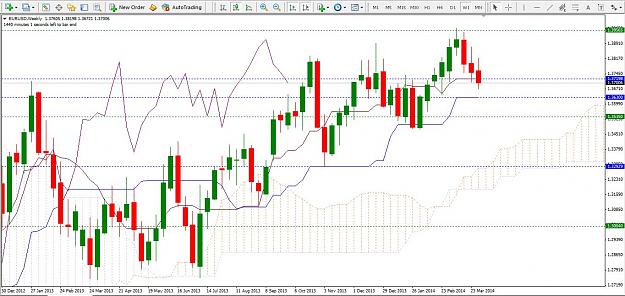
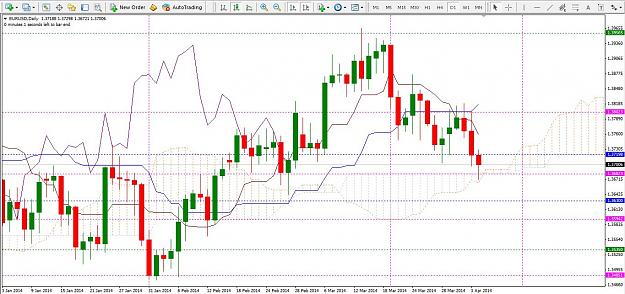
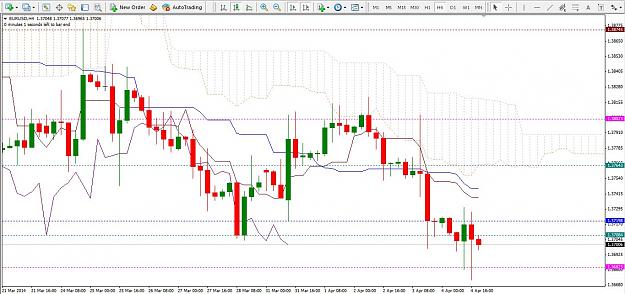
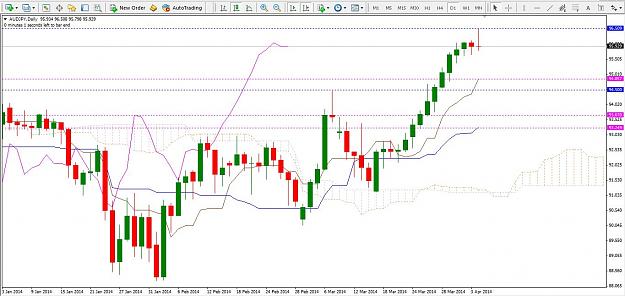
Ichimoku Kinko Hyo translates to 'one glance equilibrium chart' or 'instant look at the balance chart' and is sometimes referred to as 'one glance cloud chart' based on the unique 'clouds' that feature in ichimoku charting.

Ichimoku is a moving average-based trend identification system and because it contains more data points than standard candlestick charts, provides a clearer picture of potential price action.

The main difference between how moving averages are plotted in ichimoku as opposed to other methods is that ichimoku's lines are constructed using the 50% point of the highs and lows as opposed to the candle's closing price.

Ichimoku factors in time as an additional element along with the price action, similar to William Delbert Gann's trading ideas.

Source: http://en.wikipedia.org/wiki/Ichimok...C5%8D_Hy%C5%8D

Template:
Attached File(s)
File Type: tpl metasecret.tpl   5 KB | 1,403 downloads


Template:
Attached File(s)
File Type: tpl ichimoku.tpl   1 KB | 789 downloads | Uploaded Oct 15, 2014 10:01pm
uploaded on Oct 16, 2014

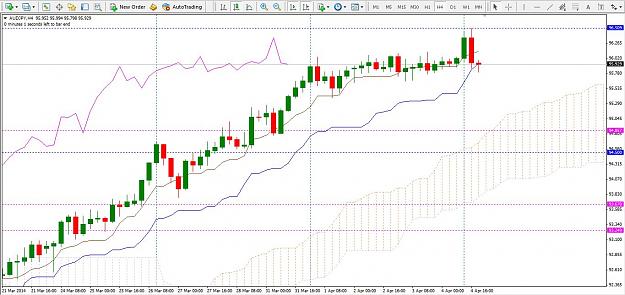
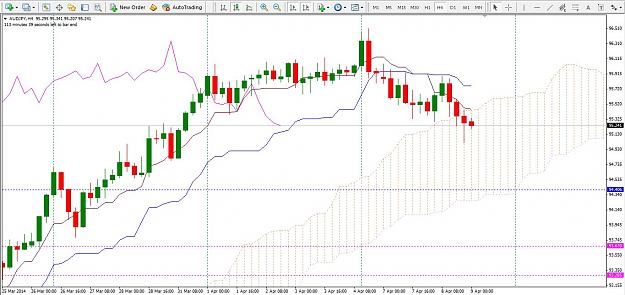
For the timing indicator, it is EJ_CandleTime_Blue, you can search google and add it by your favor.
  • Post #2
  • Quote
  • Apr 5, 2014 2:25am Apr 5, 2014 2:25am
  •  salimc
  • | Joined Jan 2012 | Status: Trader | 1,321 Posts
Congratulations for the the new thread. Would love to participate. best of luck
 
 
  • Post #3
  • Quote
  • Apr 5, 2014 2:57am Apr 5, 2014 2:57am
  •  FerruFx
  • Joined May 2007 | Status: MT4/MT5 EAs/Indicators/Alerts coder | 6,423 Posts
You should provide the source of your post ... ( http://en.wikipedia.org/wiki/Ichimok...C5%8D_Hy%C5%8D ).
MT4/MT5 EAs/Indicators/Alerts coder
 
 
  • Post #4
  • Quote
  • Edited 4:38am Apr 5, 2014 3:44am | Edited 4:38am
  •  MetaSecret
  • | Joined Mar 2014 | Status: Member | 184 Posts
This is first look of my ichimoku style.

On MetaTrader4, it is available in Indicator tab. You can modify color or style yourself and don't need to change any parameters.

It is good to start analysis from weekly chart. We can see that price still above the cloud and this pair is on the up trend. However, there are three weeks pullback from the year high 1.3956. Price is now on the way to 1.3630 and major support is 1.3535

Attached Image (click to enlarge)
Click to Enlarge

Name: ff-050414-eu.JPG
Size: 162 KB


Here is daily chart

On April 3, after price touched 1.3800 then went down and closed at 1.3719 also weekly support as ECB's conference. The pair struggled between 1.3719 and daily support 1.3682 (cloud) and closed with a long nose yesterday.

Attached Image (click to enlarge)
Click to Enlarge

Name: ff-050414d1-eu.JPG
Size: 160 KB


So, what am I looking for? A buy signal from 1.3685 area with a stop loss 30 pips and take profit 1.3735 if market condition is good.

Attached Image (click to enlarge)
Click to Enlarge

Name: ff-050414h4-eu.JPG
Size: 146 KB
 
 
  • Post #5
  • Quote
  • Apr 5, 2014 4:43am Apr 5, 2014 4:43am
  •  MetaSecret
  • | Joined Mar 2014 | Status: Member | 184 Posts
Quoting FerruFx
Disliked
You should provide the source of your post ... ( http://en.wikipedia.org/wiki/Ichimok...C5%8D_Hy%C5%8D ).
Ignored
Thank you for suggesting.

Quoting salimc
Disliked
Congratulations for the the new thread. Would love to participate. best of luck
Ignored
Welcome, salimc.
 
 
  • Post #6
  • Quote
  • Apr 5, 2014 4:58am Apr 5, 2014 4:58am
  •  iqyu5an
  • Joined Jul 2010 | Status: Always manage your risk & leverage | 7,327 Posts
hope this will help. sharing for ichimoku lover

http://www.traderji.com/futures/3060...ng-system.html
not euphoria follower
 
 
  • Post #7
  • Quote
  • Apr 5, 2014 7:08am Apr 5, 2014 7:08am
  •  MetaSecret
  • | Joined Mar 2014 | Status: Member | 184 Posts
Quoting iqyu5an
Disliked
hope this will help. sharing for ichimoku lover http://www.traderji.com/futures/3060...ng-system.html
Ignored
Thanks, it's good to read, this person quotes from EII Capital materials for some beginning pages.
 
 
  • Post #8
  • Quote
  • Apr 6, 2014 1:54am Apr 6, 2014 1:54am
  •  MetaSecret
  • | Joined Mar 2014 | Status: Member | 184 Posts
High probability short setup for AUD / JPY

10 days up and nice hanging man candle on April 03, plus a dragonfly doji candle which show that possible reversal coming soon. So I am looking for short this pair.

Attached Image (click to enlarge)
Click to Enlarge

Name: ff-060414d1-aj.JPG
Size: 132 KB


H4 chart, you can see that there is a bearish divergence if you add oscillator indicator such as MACD or RSI. As an ichimoku trader, we aware that price is at kijun, also signals the uptrend has difficulty.

Attached Image (click to enlarge)
Click to Enlarge

Name: ff-060414h4-aj.JPG
Size: 143 KB
 
 
  • Post #9
  • Quote
  • Apr 6, 2014 3:46am Apr 6, 2014 3:46am
  •  egkid
  • Joined Apr 2008 | Status: Member | 9,414 Posts
Quoting MetaSecret
Disliked
High probability short setup for AUD / JPY 10 days up and nice hanging man candle on April 03, plus a dragonfly doji candle which show that possible reversal coming soon. So I am looking for short this pair. {image} H4 chart, you can see that there is a bearish divergence if you add oscillator indicator such as MACD or RSI. As an ichimoku trader, we aware that price is at kijun, also signals the uptrend has difficulty. {image}
Ignored
Looks to me still room to up
unless we see close under 94.65
Take care
 
 
  • Post #10
  • Quote
  • Apr 6, 2014 5:59am Apr 6, 2014 5:59am
  •  MetaSecret
  • | Joined Mar 2014 | Status: Member | 184 Posts
Thanks egkid, welcome comment. If so, where will you go long or wait for signal? You can post your chart.
 
 
  • Post #11
  • Quote
  • Apr 6, 2014 6:34am Apr 6, 2014 6:34am
  •  egkid
  • Joined Apr 2008 | Status: Member | 9,414 Posts
Quoting MetaSecret
Disliked
Thanks egkid, welcome comment. If so, where will you go long or wait for signal? You can post your chart.
Ignored
U can wait or trade small tf all can give ++ even u sell or buy because Looks to me will ranging "correction " then up

For me I wait and watch 94
GL
Later when i can will post a chart of mine
 
 
  • Post #12
  • Quote
  • Apr 7, 2014 2:48am Apr 7, 2014 2:48am
  •  Danny Maina
  • | Joined Mar 2013 | Status: SMART TRADES ONLY! | 675 Posts
Quoting MetaSecret
Disliked
High probability short setup for AUD / JPY 10 days up and nice hanging man candle on April 03, plus a dragonfly doji candle which show that possible reversal coming soon. So I am looking for short this pair. {image} H4 chart, you can see that there is a bearish divergence if you add oscillator indicator such as MACD or RSI. As an ichimoku trader, we aware that price is at kijun, also signals the uptrend has difficulty. {image}
Ignored
Still bullish to a great extent. Kind of market where I would rather wait for a corrective move for more buying opps at the present.
However if touches or falls below the kumo, then the bearish outlook may be positive.
 
 
  • Post #13
  • Quote
  • Apr 7, 2014 3:55am Apr 7, 2014 3:55am
  •  MetaSecret
  • | Joined Mar 2014 | Status: Member | 184 Posts
Quoting Danny Maina
Disliked
Still bullish to a great extent. Kind of market where I would rather wait for a corrective move for more buying opps at the present. However if touches or falls below the kumo, then the bearish outlook may be positive.
Ignored
Where would you like to add long position, Danny Maina?
 
 
  • Post #14
  • Quote
  • Apr 7, 2014 5:34am Apr 7, 2014 5:34am
  •  Danny Maina
  • | Joined Mar 2013 | Status: SMART TRADES ONLY! | 675 Posts
Quoting MetaSecret
Disliked
{quote} Where would you like to add long position, Danny Maina?
Ignored
Actually there goes the buy signal:
Attached Image (click to enlarge)
Click to Enlarge

Name: Screenshot2.png
Size: 43 KB
 
 
  • Post #15
  • Quote
  • Apr 7, 2014 5:50am Apr 7, 2014 5:50am
  •  MetaSecret
  • | Joined Mar 2014 | Status: Member | 184 Posts
Only Cloud and MAs, could you tell me the way you trade, thanks.
 
 
  • Post #16
  • Quote
  • Apr 7, 2014 2:38pm Apr 7, 2014 2:38pm
  •  MetaSecret
  • | Joined Mar 2014 | Status: Member | 184 Posts
First day of week price movement was slow.

Attached Image (click to enlarge)
Click to Enlarge

Name: Capture.JPG
Size: 74 KB
 
 
  • Post #17
  • Quote
  • Apr 7, 2014 3:00pm Apr 7, 2014 3:00pm
  •  MetaSecret
  • | Joined Mar 2014 | Status: Member | 184 Posts
Quoting MetaSecret
Disliked
This is first look of my ichimoku style. On MetaTrader4, it is available in Indicator tab. You can modify color or style yourself and don't need to change any parameters. It is good to start analysis from weekly chart. We can see that price still above the cloud and this pair is on the up trend. However, there are three weeks pullback from the year high 1.3956. Price is now on the way to 1.3630 and major support is 1.3535 {image} Here is daily chart On April 3, after price touched 1.3800 then went down and closed at 1.3719 also weekly support as...
Ignored
Sometimes I prefer to use chart with only candle marked support / resistance base on ichimoku like this one. This pair as my analysis is up but I don't have 1.3685 area to go long, so this trade was missed.

Attached Image (click to enlarge)
Click to Enlarge

Name: Capture.JPG
Size: 111 KB
 
 
  • Post #18
  • Quote
  • Apr 8, 2014 6:52am Apr 8, 2014 6:52am
  •  MetaSecret
  • | Joined Mar 2014 | Status: Member | 184 Posts
My NU long entry was quite early so this trade had little draw down

Attached Image (click to enlarge)
Click to Enlarge

Name: Capture.JPG
Size: 53 KB
 
 
  • Post #19
  • Quote
  • Apr 8, 2014 7:10pm Apr 8, 2014 7:10pm
  •  MetaSecret
  • | Joined Mar 2014 | Status: Member | 184 Posts
What do we have?

AUDJPY still goes lower

Attached Image (click to enlarge)
Click to Enlarge

Name: Capture.JPG
Size: 138 KB
 
 
  • Post #20
  • Quote
  • Apr 9, 2014 2:13pm Apr 9, 2014 2:13pm
  •  piplus
  • | Joined Mar 2013 | Status: Member | 51 Posts
Hello MetaSecret and all.

Im using ichimoku kinko hyo and getting the hang.

I'm using the strategy of price breaks out kumo. I use 4 clouds in my chart, an H1, H4 and D1 default for easy reading of possible supports and resistances + PVA volume indicator by SonicRSystem. a combination that is proving to be very good.

look examples of entry in AUDUSD and my entries today in EURUSD.
Attached Image(s) (click to enlarge)
Click to Enlarge

Name: audusdh1a.png
Size: 166 KB
Click to Enlarge

Name: eurusdh1sdf.png
Size: 117 KB
 
 
  • Trading Systems
  • /
  • Ichimoku Kinko Hyo
  • Reply to Thread
    • Page 1 23456 16
    • Page 1 234 16
0 traders viewing now
  • More
Top of Page
  • Facebook
  • Twitter
About FF
  • Mission
  • Products
  • User Guide
  • Media Kit
  • Blog
  • Contact
FF Products
  • Forums
  • Trades
  • Calendar
  • News
  • Market
  • Brokers
  • Trade Explorer
FF Website
  • Homepage
  • Search
  • Members
  • Report a Bug
Follow FF
  • Facebook
  • Twitter

FF Sister Sites:

  • Metals Mine
  • Energy EXCH
  • Crypto Craft

Forex Factory® is a brand of Fair Economy, Inc.

Terms of Service / ©2023