• Home
  • Forums
  • Trades
  • News
  • Calendar
  • Market
  • Brokers
  • Login
  • Join
  • User/Email: Password:
  • 10:24pm
Menu
  • Forums
  • Trades
  • News
  • Calendar
  • Market
  • Brokers
  • Login
  • Join
  • 10:24pm
Sister Sites
  • Metals Mine
  • Energy EXCH
  • Crypto Craft

Options

Bookmark Thread

First Page First Unread Last Page Last Post

Print Thread

Similar Threads

TDI-ADX System (swing trading using TDI) 116 replies

FinoHardTdi Combo "Fibonacci + Harmonic + TDI" system 129 replies

Easy Does It off the TDI indicator - EDI TDI 134 replies

TDI Trading system 5 replies

AXL - 15M Trading System - HA, Stoch, TDI 37 replies

  • Trading Systems
  • /
  • Reply to Thread
  • Subscribe
  • 94
Attachments: TDI H1 Chaos System
Exit Attachments
Tags: TDI H1 Chaos System
Cancel

TDI H1 Chaos System

  • Last Post
  •  
  • Page 1 23456 10
  • Page 1 234 10
  •  
  • Post #1
  • Quote
  • First Post: Edited Jan 1, 2014 1:16am Dec 29, 2013 11:13am | Edited Jan 1, 2014 1:16am
  •  chaosbun
  • Joined Dec 2013 | Status: Member | 599 Posts
TDI H1 Chaos System

I am from Singapore, age 25.

Decided to start my own system, would like to gather like mind fellow traders to discuss about trading using TDI and other indicator.

I will share some of my insights recently. Our eyes often see price in the way we think it should go, but do we really see what the price is telling us?

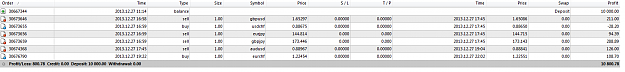
The account is currently trading on Demo, but I got real money elsewhere which is not Mt4 platform to trade on my takes.
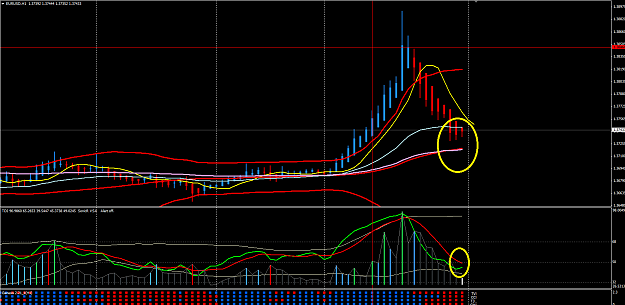
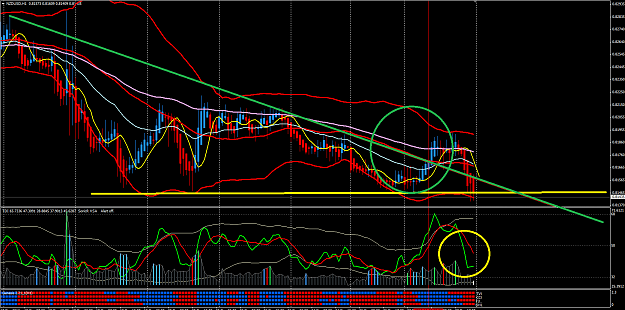
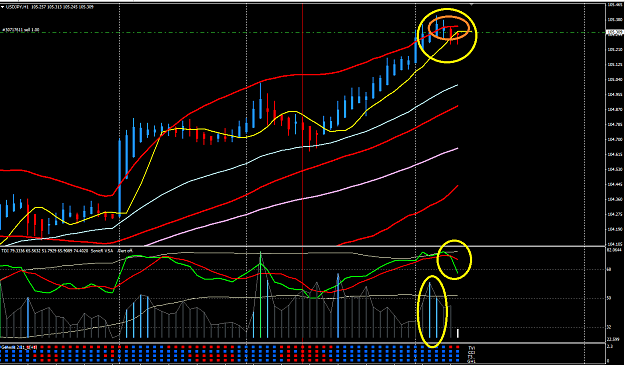
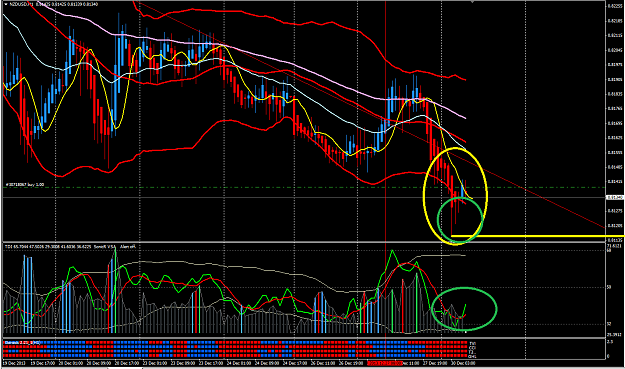
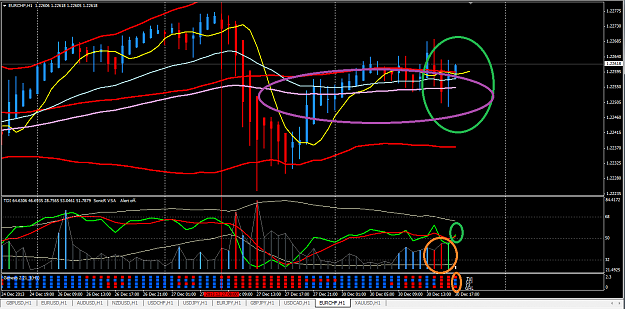
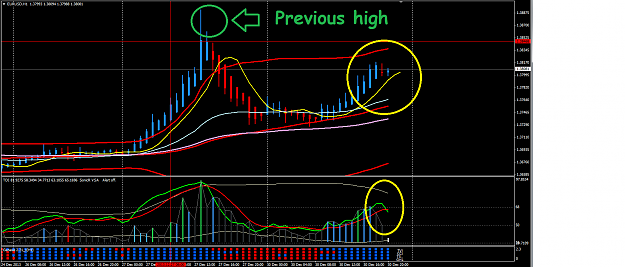
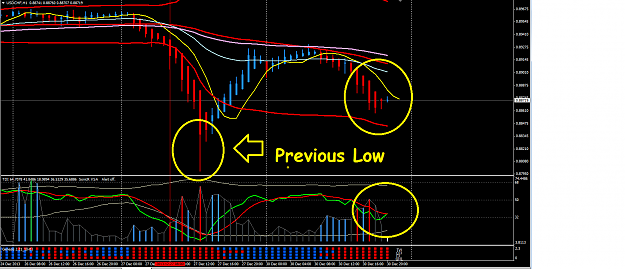
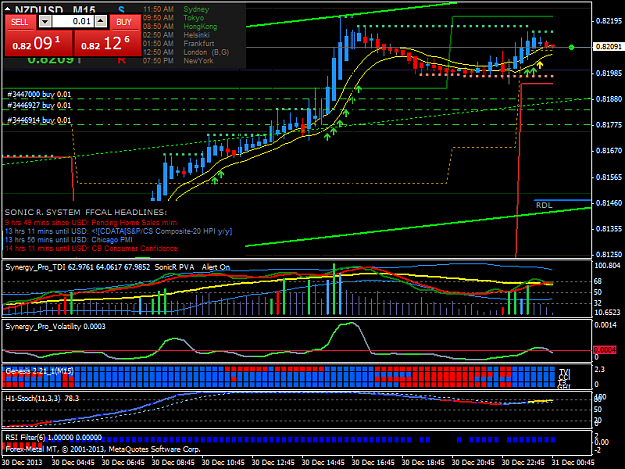
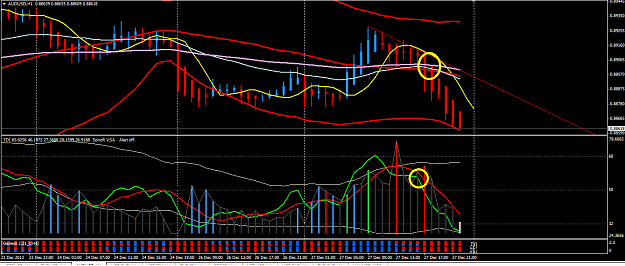
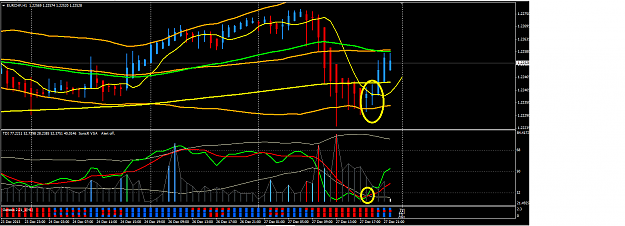
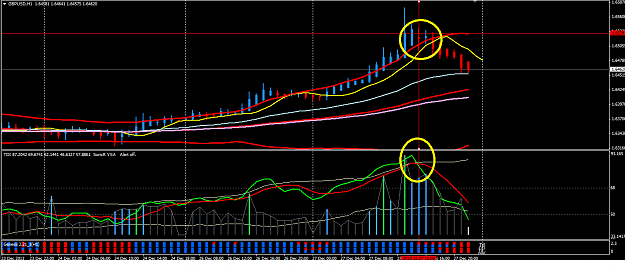
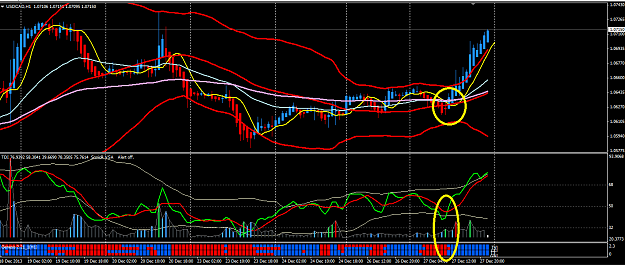
The trade I take here was cut short because I just simply want to test my entry.

Attached Image (click to enlarge)
Click to Enlarge

Name: 28DEC2013.png
Size: 23 KB


Attached Image (click to enlarge)
Click to Enlarge

Name: aud_usd_short.png
Size: 49 KB

Attached Image (click to enlarge)
Click to Enlarge

Name: eurchf_long.png
Size: 50 KB

Attached Image (click to enlarge)
Click to Enlarge

Name: gu_short.png
Size: 41 KB

Attached Image (click to enlarge)
Click to Enlarge

Name: usdcad_long.png
Size: 53 KB


Indicators I use:

TDI
Bollinger Band 50/2
Genesis Matrix
5, 34 , 89 EMA moving average
PVA Indicator(Volume)


*Sharing a bit of how this works*


Basically, if you use before TDI indicator (Trader Dynamic Index), its simply made up of RSI & Bollinger Band, I not sure the exact definition but basically


TDI

Take a long when green cross red in upward
Take a short when green cross red in downward

Angel of the cross is suppose be 1/2 o clock for a good long
Angel of the cross is suppose be 5/6 o clock for a good short


Using 34/89 EMA

Basically 89 EMA we call it the Trend Line, 34 EMA is the Dragon Line ( Thanks master sonic classic )

When 89 cut below 34 EMA, its a sign of bullish
While 89 cut above 34 ema, its a sign of bearish.

When price fall below 5 EMA shift 2, its a sign of bearish, and vice versa for bullish.


Using Bollinger band

When bollinger band cut through middle line in upward , it suppose be a bullish symptoms the chance of breaking new high is possible.
Same vice versa for bearish.

Genesis Matrix

I use it to notice the changes of color of the 4 indicator use in Genesis Matrix System, upon a entry of TDI, the next 2 candles ( possible the next 2 x 1 hr candle will show a change in ) e.g full 4 red to 1 red or 4 white to 1 white ( change in trend )


Using H1 Time frame is a better "Follow the Trend" and not picking Low/High of a movement.
Its more reliable and lesser noise.

Volume:

Basically if you see TDI cut through in a bullish or bearish manner, there tend to be volume of Support/Resistance in the low or high, after 1-2 candles, from low or high, the trend is to follow what the market direction is.


Not sure if my thread is something useful to anyone here, but if anyone would like me to continue share and guide, do let me know, I will post my takes too.


Enjoy trading.

Many people would say, using so many indicators only confuse you and it make your entry harder, but had anyone actually thought of, combining different indicator and workable system into 1 would make it a stronger 1.

Everything had 2 sides

Attached Image (click to enlarge)
Click to Enlarge

Name: YY.jpg
Size: 110 KB


Credits:

Regarding the 5 EMA shift 2 & TDI , its inspired from elfanz Trading made simple post.
34 EMA and 89 EMA is inspired from Sonic System
Volume is inspired from TAH
Genesis Matrix is inspired from Genesis Matrix System
Bollinger Band 50/2 is inspired from some youtube video on how bollinger band works.


How to setup the chaos system

Step 1:

Attached File(s)
File Type: mq4 TDI Red Green.mq4   9 KB | 1,247 downloads | Uploaded Jan 1, 2014 12:53am

Attached File(s)
File Type: ex4 Synergy_APB.ex4   4 KB | 965 downloads | Uploaded Jan 1, 2014 12:53am

Attached File(s)
File Type: ex4 Heiken Ashi.ex4   4 KB | 859 downloads | Uploaded Jan 1, 2014 12:53am


Download the above 3 indicators.

Step 2

For Genesis Matrix 2.2.1, you need go to realjumper thread to download on his first post, download the genesis_ind_templ.zip

http://www.forexfactory.com/showthread.php?t=373796

Credits: Genesis Matrix Trading Thread

From this zip file, you need to get Genesis Matrix 2.21_1 indicator, its fine if you want to paste all the indicators to the indicator folder too.


Step 3

Download

Sonic R By GuruKris.rar 1.1 MB | 48,979 downloads | Uploaded Jun 17, 2012 9:37am

at http://www.forexfactory.com/showthread.php?t=114792

Credits: Sonic R. System by sonicdeejay

From this rar file, you need to get the Indicator: SonicR VSA Histogram (Black) its fine if you want to paste all the indicators to the indicator folder too.

If you don't know how to extract an *.rar file, you can download the extractor at rarlabs.com


Below is the system Template

Attached File(s)
File Type: tpl chaos_bun_setup.tpl   7 KB | 868 downloads | Uploaded Jan 1, 2014 12:51am


Indicators are to be place in Indicators folder example: C:\Program Files (x86)\FXCM MetaTrader 4\experts\indicators
Template are to be place in Template folder example: C:\Program Files (x86)\FXCM MetaTrader 4\templates

Take note that different mt4, different users have different root path, I just give u the full path detail so you can analyze it and apply to your own computer.


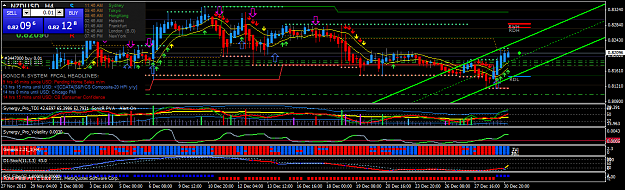
The Template Explain:

The pink line is the trend line

The grey line is the dragon line

The 3 red line is the bollinger band , highest red line is Upper Band, lowest red line is Lower Band , and middle red line is Middle Band.
The yellow line on chart is the 5 EMA shift 2

Green is high volume of buying
Red is high volume of selling

Genesis Squares, Blue is Bull, Red is Bear

4 Blue box = trend is on bullish
4 Red box = trend is on bearish

Anyone are free to shares their chaos system here, I always welcome new indicator to make the chart more powerful And help each other here to be more educated of useful indicators.
Learn to Trade is Important. Keep your bias & ego aside.
  • Post #2
  • Quote
  • Edited 2:10pm Dec 29, 2013 1:41pm | Edited 2:10pm
  •  chaosbun
  • Joined Dec 2013 | Status: Member | 599 Posts
Possible Reversal for E/U at 1.372 zone. Price might be driven up again to continue the uptrend.

Since this system is declare as chaos.. I will base my bias of trading on few things.

There reason why the price might drive up again.

Take a look at this chart from Oanda Open Position

Attached Image


Simple reading tell you that majority of retail traders are doing Short EU and GU on large scale.
Liquidity is low and Market Maker can easily wash away weak short in this week.


The other thing to warn is possibility of fresh long by E/U

Attached Image (click to enlarge)
Click to Enlarge

Name: eu_fresh_long.png
Size: 52 KB


Price is approaching middle of bollinger band , near 1.372 , and TDI is at the low, possible good place to add new long.


IF 75% of the retail position are like shorting E/U and G/U, would the big money really let them to do so ? Perhaps another test of 1.39 is possible to make a double top where market maker might add fresh short there and then on the 2nd week of january would probably see E/U start sell off as its approach the next ECB meeting.

This week will be best week for market maker to drive price up and then add new short.

Only if price cut below 1.3680, then I will believe the trend start to change to downside. I will probably add new long IF my system indicate a long entry and put my stop loss somewhere at 1.3650 - 70 area .

Another few good trade will be probably a GU long and NZD USD long


NZD/USD chart

Attached Image (click to enlarge)
Click to Enlarge

Name: nzd_usd.png
Size: 87 KB


NZD/USD break the down trend line but fall below to the "triple/quadruple" bottom, where on previous few occasion was met with strong volume, it is possible that NZD/USD will be targeting upside soon of 200-300 pips.

Another possibility is that Gov Wheeler been saying about possible NZD/USD interest rate raise in this coming 2014, I guess its good to pick NZD/USD than AUD/USD for 2014.

TDI is also start to bend straight 3 o clock which when near the low. I might wait for my chance to entry a good long on NZD/USD

There also possibility NZD/USD might be more adventure and take a dip to 0.8080 and meet with buying.


Just trade with caution.
Learn to Trade is Important. Keep your bias & ego aside.
 
 
  • Post #3
  • Quote
  • Dec 29, 2013 1:43pm Dec 29, 2013 1:43pm
  •  Davit
  • Joined Feb 2012 | Status: Member | 21,210 Posts
May I ask a question.This is more for my intellectual curiosity and does not invalidate your system.
Why 89 EMA and not 50 or 72 or 100.What's special about 89.Same for 34 why not 20,21 10?
When people place indicators and not provide valid reasons why so then I start assuming this person is shooting in the dark and hoping something sticks.
It may not be the case but that's the impression I get.
Regards
In trading, you have to be defensive and aggressive at the same time
 
 
  • Post #4
  • Quote
  • Dec 29, 2013 2:02pm Dec 29, 2013 2:02pm
  •  chaosbun
  • Joined Dec 2013 | Status: Member | 599 Posts
Quoting Davit
Disliked
May I ask a question.This is more for my intellectual curiosity and does not invalidate your system. Why 89 EMA and not 50 or 72 or 100.What's special about 89.Same for 34 why not 20,21 10? When people place indicators and not provide valid reasons why so then I start assuming this person is shooting in the dark and hoping something sticks. It may not be the case but that's the impression I get. Regards
Ignored
Its a very good question that you ask.
I can give you a frank answer why I use 89 EMA and not 50,72 or 100.

I was learning Sonic Classic from Version 3, the PDF that I read was talking about 89 EMA and 34 EMA LOW,HIGH,CLOSE for Sonic Dragon.

The idea was that 89 is suppose to be the trend line, while 34 EMA is known as Sonic Dragon, if its direction tilted towards 1/2 oclock is a bullish while a 4/5/6 is a bearish entry.

On my observation for a very long time that when trend change, the pink line(my 89ema) will cut through my 34EMA.
The gap between the 89 EMA and 34EMA when near trend change will close up and you can see 89 EMA pointing towards 34 EMA like its going pierce through it.

While a strong trend will start to widen the 34EMA and 89EMA.

Although sometime it could be fake out, that is why I use TDI and Bollinger Band with observing price action on "Support/Resistance" to minimize the entry as a bad entry.


Why I pick 89,34 EMA is simply because I am following Sonic Classic all along. And I pick up Genesis Matrix, Follow by Trading Made Simple, and then read up on Bollinger band through youtube video, to create this system.

I might not be right, there could be better system cater for different people, but what we as forex trader need is a system that can make us consistent money.
And why I create this thread is to give myself a space to teach other while teaching myself and also to learn from others

If you got other EMA which can speak the trend clearer, you are welcome to share.


Indicator cannot predict future price, but it can tell you how the market is behaving.

Once again thanks for participating !! Cheers Happy 2014
Learn to Trade is Important. Keep your bias & ego aside.
 
 
  • Post #5
  • Quote
  • Dec 29, 2013 2:12pm Dec 29, 2013 2:12pm
  •  Davit
  • Joined Feb 2012 | Status: Member | 21,210 Posts
Quoting chaosbun
Disliked
{quote} Its a very good question that you ask. I can give you a frank answer why I use 89 EMA and not 50,72 or 100. I was learning Sonic Classic from Version 3, the PDF that I read was talking about 89 EMA and 34 EMA LOW,HIGH,CLOSE for Sonic Dragon. The idea was that 89 is suppose to be the trend line, while 34 EMA with the sonic dragon direction tilted towards 1/2 oclock is a bullish while a 4/5/6 is a bearish entry. On my observation when trend change, the pink line(my 89ema) will cut through my 34EMA. Although sometime it could be fake out, that...
Ignored

Good luck brother.
Thanks for your explanations.
I can't help but add few observations.2013 Jan USD started very bullish and we could see same 2014 Jan.
What this means NU you mentioned could dive back to 78-77 support levels but area of importance is 7890-78 which is harmonic zone.None of what I said could be applied to this system but since you mentioned NU I just added my 2c
Regards
Attached Image (click to enlarge)
Click to Enlarge

Name: nzdusd.weekly.png
Size: 44 KB
In trading, you have to be defensive and aggressive at the same time
 
 
  • Post #6
  • Quote
  • Edited Dec 30, 2013 12:11am Dec 29, 2013 11:22pm | Edited Dec 30, 2013 12:11am
  •  chaosbun
  • Joined Dec 2013 | Status: Member | 599 Posts
Quoting Davit
Disliked
{quote} Good luck brother. Thanks for your explanations. I can't help but add few observations.2013 Jan USD started very bullish and we could see same 2014 Jan. What this means NU you mentioned could dive back to 78-77 support levels but area of importance is 7890-78 which is harmonic zone.None of what I said could be applied to this system but since you mentioned NU I just added my 2c Regards {image}
Ignored


Hi brother, thanks for sharing harmonic trading & fibo points.

I used to follow harmonic chart since fibo point is key zone of s/r too

Historic price might happen like 2013 jan is bullish for usd but there also a possibility of changes as you know last year yen doesnt devalue as much as this year, every trading session is unique.

What you mention is possible if we see the fibo point at 50.0% get breach through, but if its hold, we can see point C being form which is at possible 0.830 to 0.840 area.

I will still be careful of being over USD bullish after what happen previously, we can also see that funds are being deposit into Euro Zone and UK.

Commodities currencies like NZD which boost of possible interest rate rise might be a good deal soon until Wheeler say the price is too high.


Anyway, this is my today pick, I risking 32 pips with my SL at 0.8820

AUD/USD Long Entry

Attached Image (click to enlarge)
Click to Enlarge

Name: aulong.png
Size: 67 KB


Risk : High Risk but limited with SL in place. at 0.8820 because its like picking the low.

Reasons:

Bollinger Band LOW
TDI Crosses
High Volume at LOW
Genesis Squares start to turn color

USD/JPY Short Entry

Attached Image (click to enlarge)
Click to Enlarge

Name: ujshort.png
Size: 56 KB


Risk : High Risk but limited with SL in place. at 105.55 because its like picking the high.

Reasons:

Bollinger Band Top
TDI Crosses
High Volume at High
Genesis Squares start to turn color


NZD/USD Long

Attached Image (click to enlarge)
Click to Enlarge

Name: nzdusdlong.png
Size: 89 KB


Risk: Extreme High due to bullish bar not strong enough as for now.
SL at 0.8105

Reasons:

Bollinger Band LOW
TDI Crosses
Some buying at LOW


## All the trades I post here is trade with my real money at a Non-mt4 platform, the mt4 platform i do open similar trade using Demo Account.
## All trades place here is to test the System and to get a firm answer from the market, if thing work well over time, the system will be teach with a comprehensive PDF guide and help the rest of Forumer to make consistent forex earning.
## This post is just for educational purpose, does not bear any signal providing service or related.
Learn to Trade is Important. Keep your bias & ego aside.
 
 
  • Post #7
  • Quote
  • Dec 30, 2013 12:16am Dec 30, 2013 12:16am
  •  vox dei
  • Joined Aug 2010 | Status: Chaos is a ladder | 1,268 Posts
Quoting Davit
Disliked
May I ask a question.This is more for my intellectual curiosity and does not invalidate your system. Why 89 EMA and not 50 or 72 or 100.What's special about 89.Same for 34 why not 20,21 10? When people place indicators and not provide valid reasons why so then I start assuming this person is shooting in the dark and hoping something sticks. It may not be the case but that's the impression I get. Regards
Ignored
And the reason why SonicR uses ema 34 and 89 is because these are fibonacci numbers.
"To hold, you must first open your hand. Let go." - Lao Tzu
 
 
  • Post #8
  • Quote
  • Dec 30, 2013 6:49am Dec 30, 2013 6:49am
  •  pindang
  • | Joined Apr 2013 | Status: Member | 56 Posts
Hi chaos thanks for your post, it's very interesting strategy. In your system you are using bollinger and EMA, I think both have the same function as trend indicator. Why you use both?

----------
EMA crossover
 
 
  • Post #9
  • Quote
  • Dec 30, 2013 7:21am Dec 30, 2013 7:21am
  •  chaosbun
  • Joined Dec 2013 | Status: Member | 599 Posts
All trades are close

Make near 10% return on my investment. Withdrawn the profit. Cheers
Learn to Trade is Important. Keep your bias & ego aside.
 
 
  • Post #10
  • Quote
  • Dec 30, 2013 7:23am Dec 30, 2013 7:23am
  •  chaosbun
  • Joined Dec 2013 | Status: Member | 599 Posts
Quoting pindang
Disliked
Hi chaos thanks for your post, it's very interesting strategy. In your system you are using bollinger and EMA, I think both have the same function as trend indicator. Why you use both? ---------- EMA crossover
Ignored
I am having dinner now will reply soon
Learn to Trade is Important. Keep your bias & ego aside.
 
 
  • Post #11
  • Quote
  • Dec 30, 2013 8:04am Dec 30, 2013 8:04am
  •  lghr
  • Joined Feb 2013 | Status: Member | 668 Posts
I think, no matter what to use, as long as they can make money on the line.

thank you chaosbun share
 
 
  • Post #12
  • Quote
  • Edited 9:58am Dec 30, 2013 9:40am | Edited 9:58am
  •  chaosbun
  • Joined Dec 2013 | Status: Member | 599 Posts
Quoting lghr
Disliked
I think, no matter what to use, as long as they can make money on the line. thank you chaosbun share
Ignored
True We trade forex was to make money. No matter which system we are using, as long its works, then its good

Quoting pindang
Disliked
Hi chaos thanks for your post, it's very interesting strategy. In your system you are using bollinger and EMA, I think both have the same function as trend indicator. Why you use both? ---------- EMA crossover
Ignored

The EMA 34 EMA,89 EMA and 5 EMA shift 2 is used as trend indicator too. If you saw above like what vox_dei mentions are 34 , 89 EMA are fibonacci numbers.


Bollinger band to me is to see how strong a trend is, such as when the trend broke the middle bollinger band or bounce off at middle band,
that tell me price action is going which direction.


The reason why this system is "CHAOS" is because I don't just look purely on 1 system to entry, you can see I even take Oanda Open Position to see the Retail Traders Bias, see what I type before market open and see the price of EU and GU now, they are heading towards upside again.


Performance for Today (Demo) - I got real money at some non mt4 platform of CMC Markets Broker Singapore which make about 10% on the amount I invest today.

Attached Image (click to enlarge)
Click to Enlarge

Name: performance.png
Size: 13 KB


To potential follower of my Chaos TDI H1 System, feel free to ask question about the system.

I will continue post Live Chart . Normally I look at chart hourly, and not every mins or so because I am trading using H1 Time Frame. Its also suitable for Traders who want to spend lesser screen time.

But take note:

## All the trades I post here is trade with my real money at a Non-mt4 platform, the mt4 platform i do open similar trade using Demo Account.
## All trades place here is to test the System and to get a firm answer from the market, if thing work well over time, the system will be teach with a comprehensive PDF guide and help the rest of Forumer to make consistent forex earning.
## This post is just for educational purpose, does not bear any signal providing service or related.
Learn to Trade is Important. Keep your bias & ego aside.
 
 
  • Post #13
  • Quote
  • Dec 30, 2013 10:04am Dec 30, 2013 10:04am
  •  chaosbun
  • Joined Dec 2013 | Status: Member | 599 Posts
US Trading Session Pick

EUR/CHF Long

Attached Image (click to enlarge)
Click to Enlarge

Name: eurchflong.png
Size: 60 KB


1: Volume showing buying at LOW
2: TDI Crosses - Green cross Red
3: 89 EMA seems to provide some supported
4: Genesis Color Change

This pair might stuck your money, don't over trade. Due to the small movement, I consider this as a safe trade.

Risk: Not High as this pair don't move much, but how much I myself looking to make is probably
30 pips - 80 pips

SL you can decide, as for me I set my SL below 1.20 as this pair does not seems to need to set SL to me as of now.
IF want to can set somewhere below 1.2210


Anyone who use several system (Chaos) to determine price movement/trend can feel free to post his/her chart !!
Learn to Trade is Important. Keep your bias & ego aside.
 
 
  • Post #14
  • Quote
  • Dec 30, 2013 10:45am Dec 30, 2013 10:45am
  •  StevenNguyen
  • | Joined Dec 2013 | Status: Member | 54 Posts
Interestingly, my system is very very similar to yours with all the indicators. The orders you had opened today were also my orders for today, all closed with profit (although it was quite early cuz i closed it before i went to the gym). Anyways, i will follow your thread to learn and share trading experience with this system !
Regards,
SN.
 
 
  • Post #15
  • Quote
  • Dec 30, 2013 12:15pm Dec 30, 2013 12:15pm
  •  MidnightRun
  • Joined Oct 2009 | Status: Jack of All Trades | 774 Posts
Hi Chaos,

You mention volume several times in your reasons to open a trade:
"Reasons:
Bollinger Band Top
TDI Crosses
High Volume at High
Genesis Squares start to turn color"

How do you interpret volume in your decisions?

Thanks.
 
 
  • Post #16
  • Quote
  • Dec 30, 2013 1:16pm Dec 30, 2013 1:16pm
  •  chaosbun
  • Joined Dec 2013 | Status: Member | 599 Posts
Quoting StevenNguyen
Disliked
Interestingly, my system is very very similar to yours with all the indicators. The orders you had opened today were also my orders for today, all closed with profit (although it was quite early cuz i closed it before i went to the gym). Anyways, i will follow your thread to learn and share trading experience with this system ! Regards, SN.
Ignored
I also close early because I am outside having dinner and not with my chart, feel uncomfortable so just book my 10% return of investment profit.
Although if I continue hold on could book bigger profit as of now. but at least its a profit in the end (^^)


Quoting MidnightRun
Disliked
Hi Chaos, You mention volume several times in your reasons to open a trade: "Reasons: Bollinger Band Top TDI Crosses High Volume at High Genesis Squares start to turn color" How do you interpret volume in your decisions? Thanks.
Ignored


If you notice my TDI there is this blue/red/green bar which is the indicator PVA by Prof Tah of Sonic System. I using it to gauge volume, another way is just to look at price action, the low / high vs the close and see how much support/resistance is gather at that candle.
Learn to Trade is Important. Keep your bias & ego aside.
 
 
  • Post #17
  • Quote
  • Dec 30, 2013 1:24pm Dec 30, 2013 1:24pm
  •  chaosbun
  • Joined Dec 2013 | Status: Member | 599 Posts
Possible Return of USD Strength after the Early weakness. (possible month end fixing )

Attached Image (click to enlarge)
Click to Enlarge

Name: eushort.png
Size: 54 KB


Attached Image (click to enlarge)
Click to Enlarge

Name: usdchf.png
Size: 53 KB


Both are risky trades because its like picking the high and low, but it din't break the previous lower low(usd chf) or higher high (eur/usd) so its sort of follow the trend.

This 2 trades might experience up to 100 pips drawdown if the market maker decide to continue push to wipe out weak position. or it could be a retrace of 30-60 pips

Trade with caution.
Learn to Trade is Important. Keep your bias & ego aside.
 
 
  • Post #18
  • Quote
  • Dec 30, 2013 2:05pm Dec 30, 2013 2:05pm
  •  MidnightRun
  • Joined Oct 2009 | Status: Jack of All Trades | 774 Posts
Quoting chaosbun
Disliked
{quote} If you notice my TDI there is this blue/red/green bar which is the indicator PVA by Prof Tah of Sonic System. I using it to gauge volume, another way is just to look at price action, the low / high vs the close and see how much support/resistance is gather at that candle.
Ignored
Let me put it differently: if you see a TDI cross with high volume this tells you that the current trend is going to reverse?
Thanks
 
 
  • Post #19
  • Quote
  • Dec 30, 2013 8:14pm Dec 30, 2013 8:14pm
  •  StevenNguyen
  • | Joined Dec 2013 | Status: Member | 54 Posts
Re-entry on NZD/USD last night before i sleep and after the important USD news released:

The reasons are:

  1. Bullish candle crossed the trend line on H4 chart
  2. TDI and Genesis were set up for long
  3. RSI filter indicated long
  4. And ofc, released news supported long set-up (in short term)

Ok, so wake up this morning and see the long trend is still running that has brought me about 80+ pips in total. I thought about closing the orders but i decided to keep it run until EU open, due to:

  1. Break out into 15 minutes chart, i can see the increasing of long volumes
  2. The candles has broken its previous day high and it has now became a support

Although i kept it running for profits, i realized that it is quite risky because i am going against the bearish trend. So lets see the how the market behaves for today when its the last day of the year.

Btw, Happy New Year to everyone !

SN.

Attached Image(s) (click to enlarge)
Click to Enlarge

Name: 1.png
Size: 68 KB
Click to Enlarge

Name: 2.png
Size: 54 KB
 
 
  • Post #20
  • Quote
  • Dec 30, 2013 8:28pm Dec 30, 2013 8:28pm
  •  blamshakk
  • Joined Mar 2010 | Status: Member | 2,162 Posts
there is already a realtime TDI indi out there.

just my $0.02

Quoting dkrock
Disliked
I would like to tell you something, but please do not consider it arguing. I am just expressing an alternate opinion based on my experience. I understand you use 89 because someone else used 89. But you do not know why exactly. Supposedly because it is a fibo number. So, in other words, big deal...it was simply made up by someone who doesn't really understand indicators applied to timed charts. The centerpiece of a TDI indicator is the 34 moving average. Therefore, any additional moving averages to determine "trend" (whatever that is) should be...
Ignored
 
 
  • Trading Systems
  • /
  • TDI H1 Chaos System
  • Reply to Thread
    • Page 1 23456 10
    • Page 1 234 10
0 traders viewing now
  • More
Top of Page
  • Facebook
  • Twitter
About FF
  • Mission
  • Products
  • User Guide
  • Media Kit
  • Blog
  • Contact
FF Products
  • Forums
  • Trades
  • Calendar
  • News
  • Market
  • Brokers
  • Trade Explorer
FF Website
  • Homepage
  • Search
  • Members
  • Report a Bug
Follow FF
  • Facebook
  • Twitter

FF Sister Sites:

  • Metals Mine
  • Energy EXCH
  • Crypto Craft

Forex Factory® is a brand of Fair Economy, Inc.

Terms of Service / ©2023