Disliked{quote}At closing of yesterday's candle - according to my chart - was at 142.399 which placed the next open Daily at 17:00 ET above the 50%. And according to my 1 hour chart that was the entry for the long as soon as the open Daily had took place. If I had not been in the long prior to closing of yesterday's you can be sure I would had been in the long at opening of yesterday's opening because that opening was right on the 1 hour support. On Sunday's and Monday's opening was for the short and again the 50% is the starting point on both days, and...Ignored
I have a couple of questions since I use this spreadsheet applied to days and weeks.
If you'd be so kind, could you please explain the 40/40 rule applied for example to this spreadsheet's S/R's.
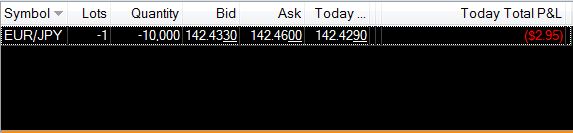
Did all these 3 trades you took on sunday, monday and yesterday had this rule in place? I see monday's opening short provided like 30 pips but taking the entry a little above the spreadsheet's balance point, and then price reversed and went up probably taking you out at BE.
Another question I have is how do you know if these S/R levels will hold or not?
Thank you very much Dove and blessings.
Best time to plant a tree was 20 years ago, second best is now