• Home
  • Forums
  • Trades
  • News
  • Calendar
  • Market
  • Brokers
  • Login
  • Join
  • User/Email: Password:
  • 8:03am
Menu
  • Forums
  • Trades
  • News
  • Calendar
  • Market
  • Brokers
  • Login
  • Join
  • 8:03am
Sister Sites
  • Metals Mine
  • Energy EXCH
  • Crypto Craft

Options

Bookmark Thread

First Page First Unread Last Page Last Post

Print Thread

Similar Threads

Supply and Demand Zones 45 replies

Price movement as a function of Supply and Demand 43 replies

Supply and demand zones and EW principles 1 reply

How Markets Work, in a Nutshell! 32 replies

Demand and Supply 1 reply

  • Commercial Content
  • /
  • Reply to Thread
  • Subscribe
  • 5,247
Attachments: Supply and demand in a nutshell by Alfonso Moreno
Exit Attachments

Supply and demand in a nutshell by Alfonso Moreno

  • Last Post
  •  
  • 1 480481Page 482483484 486
  • 1 Page 482 486
  •  
  • Post #9,621
  • Quote
  • May 11, 2020 11:59pm May 11, 2020 11:59pm
  •  panoramia
  • | Commercial Member | Joined Aug 2011 | 3,525 Posts
USD CNH Chinese Yuan offshore forecast

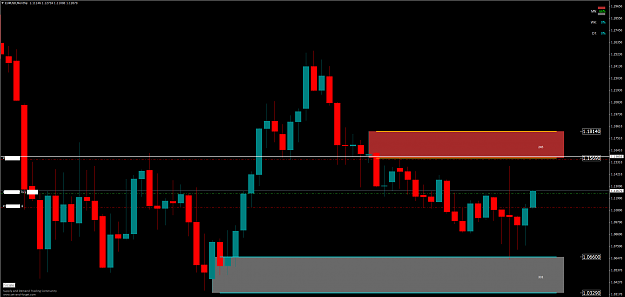
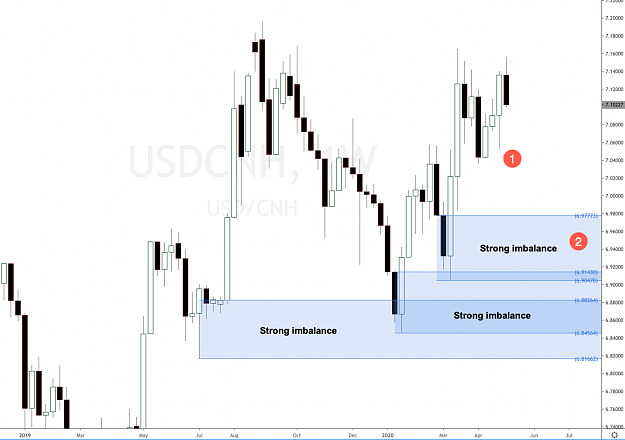
This is a quick supply and demand Forex analysis update for the Chinese currency pair, USDCNH Chinese Yuan offshore. In our last update, we were expecting this Forex cross pair to retrace to a strong weekly imbalance, it tried to a couple of weeks ago but it couldn’t make it then. Still waiting for the same scenario or a strong rally creating new imbalances.

The US dollar is very strong against Chinese Yuan offshore currency pair, reason why last two weekly demand imbalances around 6.91 and 6.87 have been respected. There is a brand-new imbalance slightly higher around 6.95 price level. Will this new imbalance be respected like the previous ones? We do not know but what we do know is that it’s a strong imbalance in a clear trend. Waiting for the same Forex trading scenario or a strong rally creating new imbalances.

Attached Image (click to enlarge)
Click to Enlarge

Name: usdcnh chinese yuan cross pair analysis.png
Size: 119 KB


Supply and demand Forex trading strategy
Set and Forget supply and demand trading community
 
 
  • Post #9,622
  • Quote
  • May 12, 2020 12:23pm May 12, 2020 12:23pm
  •  panoramia
  • | Commercial Member | Joined Aug 2011 | 3,525 Posts
The long term bias on Abbott Laboratories (NYSE: ABT) american stock is bullish, new bullish impulses and demand levels are being created. We can see some strong weekly impulses at #1 and #2 around $82 and $70 per share. As a beginner swing trader and even as en experienced swing trader, you should be looking for impulses that are strong enough to stand out in the charts, like those you can see in the technical analysis for Abbott Laboratories. This will help you locate potential trades using supply and demand imbalances.

There is a long bias on Abbott Laboratories (NYSE: ABT), expecting price to drop to #2 and potentially #1 at the bottom where longs will be possible again. See Abbott Laboratories (NYSE: ABT) pharmaceutical company technical analysis and forecast for the weekly timeframe below. You can see the price area and levels being discussed in this analysis. Similar price action can be seen on other stock from the pharmaceutical sector and industries, as well as biotechnology stocks.

Attached Image (click to enlarge)
Click to Enlarge

Name: Screenshot1.png
Size: 1,000 KB


Supply and demand Stock trading strategy
Set and Forget supply and demand trading community
 
 
  • Post #9,623
  • Quote
  • May 26, 2020 3:00am May 26, 2020 3:00am
  •  panoramia
  • | Commercial Member | Joined Aug 2011 | 3,525 Posts
NFLX chart new scenario
Netflix (NASDAQ: NFLX) has broken all time high after weeks of having the stock around $400 per share and unable to break that price area.

Last week Netflix (NASDAQ: NFLX) broke out in a strong bullish move that ended up creating a strong demand imbalance on the weekly timeframe.

Netflix price chart analysis
Two weeks ago it tried to reach the newly created imbalance around $381 per share but it just couldn’t, fell short of pulling back to it and it might continue to rally high and break all time high again.

There is definitely a long term long bias, so only buying shares of Netflix stock should be allowed, or even bullish option strategies that are neutral to bullish because that’s what the bigger picture supply and demand trend analysis is telling us to do.

Attached Image (click to enlarge)
Click to Enlarge

Name: Screenshot1.png
Size: 121 KB


Supply and demand Stock trading strategy
Set and Forget supply and demand trading community
 
 
  • Post #9,624
  • Quote
  • May 27, 2020 1:57am May 27, 2020 1:57am
  •  panoramia
  • | Commercial Member | Joined Aug 2011 | 3,525 Posts
Alibaba BABA stock scenario
Chinese e-commerce Alibaba may not qualify as an archetypal blue-chip stock, but at half a trillion dollars and growing, it’s earned significant global respect and long-term staying power. Alibaba is one of the largest company in the world’s hottest major market – even after 2020’s pandemic – Alibaba arguably enjoys better long-term growth prospects than Amazon.com and yet trades at a much smaller price.
Alibaba Group Earnings

Its cloud business, though just 7% of the company, has grown more than 50% last quarter, and still has a lot of potential. Alibaba (NYSE:BABA) has weathered the trade war between the Unites States and China pretty well as we can see in the monthly timeframe analysis below. It has also weathered the famous curveball of the pandemic beautifully, proving its resilience in the most uncertain of times.

Why hasn’t it dropped further as many other stocks worldwide? Well, there was a very strong monthly demand imbalance located around $173. It took control after the pandemic started to shatter the world markets and BABA has been rallying ever since it touched that price level last March 2020. See Alibaba Group monthly timeframe analysis and forecast below.

Attached Image (click to enlarge)
Click to Enlarge

Name: Screenshot1.png
Size: 273 KB
Set and Forget supply and demand trading community
 
 
  • Post #9,625
  • Quote
  • May 28, 2020 6:45am May 28, 2020 6:45am
  •  panoramia
  • | Commercial Member | Joined Aug 2011 | 3,525 Posts
Is Berkshire Hathaway (NYSE: BRKB), the ultimate Warren Buffett stock a buy now during the coronavirus crisis? Looks like it is, price action is telling us a lot about this stock right now.

Berkshire Hathaway Inc., through its subsidiaries, engages in insurance, freight rail transportation, and utility businesses. It provides property, casualty, life, accident, and health insurance and reinsurance; and operates railroad systems in North America.

Warren Buffett is widely regarded as one of the greatest investors of all time. It’s logical to think as a trader that one way to share in his success is to invest in his own firm, Berkshire Hathaway. BRK.B stock is building price cation that is supporting a buy now, but is it a buy amid the coronavirus crisis? Let’s take a close look at the technical performance of the ultimate Warren Buffett stock.

Take a look at Berkshire Hathaway‘s weekly timeframe in the trading analysis below. We can see a weak supply imbalance in blue that has already been tested providing with room for price to keep on rallying to test it again. There is a lot of profit margin to reach that imbalance and potentially eliminating it completely in the next couple of months.

Attached Image (click to enlarge)
Click to Enlarge

Name: Screenshot1.png
Size: 276 KB


Berkshire Hathaway stock forecast
Set and Forget supply and demand trading community
 
 
  • Post #9,626
  • Quote
  • Jun 3, 2020 9:30am Jun 3, 2020 9:30am
  •  panoramia
  • | Commercial Member | Joined Aug 2011 | 3,525 Posts
As expected Facebook (NASDAQ:FB) is getting stronger after the covid-19 coronavirus retracement. The virus was just the trigger needed for Facebook stock to be a bargain providing many long term investor the opportunity to buy thousands of Facebook shares at a very cheap price.

We have discussed Facebook stock technical analysis and forecast in the past few months, more thoroughly and detailed in Set and Forget’s stock trading community, we had no reason to sell shares of Facebook stock because there was a long term long bias. Obviously, if you are an intraday trader trading short term positions on Facebook stock, you will have plenty of trading opportunities to buy and sell shares of Facebook stock or use all kind of stock options strategies to trade in any direction, bullish or bearish.

Facebook stock chart scenario
We can see in Facebook’s weekly timeframe attached below how all time highs around $224 per share have been broken and an imbalance is in the making around $216. For long term stock traders, swing stock traders and stock scalpers, there is only on direction to trade in this scenario, buying shares of Facebook stock.

Attached Image (click to enlarge)
Click to Enlarge

Name: Screenshot1.png
Size: 222 KB


Facebook stock FB forecast
Set and Forget supply and demand trading community
 
 
  • Post #9,627
  • Quote
  • Jun 4, 2020 9:59am Jun 4, 2020 9:59am
  •  Techanalyst
  • | Membership Revoked | Joined Jul 2020 | 7,294 Posts
Quoting panoramia
Disliked
A strong monthly imbalance gained control on EURUSD last month around 1.0654. As explained in previous EURUSD forex cross pair analyses, we had a strong bearish bias but once a strong imbalance on a big timeframe like the monthly takes control, going short in smaller timeframes is not allowed and suicidal. Euro Dollar forex pair analysis Look at the strength of that monthly imbalance on EURUSD made of several strong wide candlestick bodies. EURUSD Forex cross pair has already reacted to that imbalance, it moved around 8.10% since price retraced...
Ignored
Great call on this. I have been trading it on daily and 4 hr chart since than buy wait take profit and so on. I just opened another buy position. Looks like it will go to supply zone.
Attached Image (click to enlarge)
Click to Enlarge

Name: EURUSDMonthly.png
Size: 47 KB
 
 
  • Post #9,628
  • Quote
  • Jun 8, 2020 3:26pm Jun 8, 2020 3:26pm
  •  panoramia
  • | Commercial Member | Joined Aug 2011 | 3,525 Posts
As expected and mentioned in previous EUR USD long term forecast 2020 last 10th April 2020 and even a few more weeks back, a very strong monthly imbalance gained control on EURUSD last March 2020 around 1.0654 and it has not stopped rallying ever since. As explained in previous EURUSD analyses, we had a strong bearish bias but once a strong imbalance on a big timeframe like the monthly takes control, trading shorts is a bit of a suicidal behaviour.

Euro Dollar forex pair trend analysis buy or sell?
Look at the strength of that monthly imbalance on EURUSD made of several strong wide candlestick bodies. EURUSD Forex cross pair has already reacted to that imbalance as expected since it retraced to the imbalance last March 2020.

Long term longs are possible, if monthly highs are eliminated we might see an even stronger bullish impulse as a reaction to that strong demand imbalance. We need to put this imbalance into context and decide where and how we will trade EURUSD.

Attached Image (click to enlarge)
Click to Enlarge

Name: eurusd forex cross pair forecast.png
Size: 103 KB


EURUSD forex cross pair trading strategy
Set and Forget supply and demand trading community
 
 
  • Post #9,629
  • Quote
  • Jun 9, 2020 1:46pm Jun 9, 2020 1:46pm
  •  panoramia
  • | Commercial Member | Joined Aug 2011 | 3,525 Posts
TUI AG also known as TUI Group is an Anglo-German multinational travel and tourism company and tour operator headquartered in Hannover, Germany.

TUI Group is the largest leisure, travel and tourism company in the world. And it owns travel agencies, hotels, airlines, cruise ships and retail stores. TUI AG is was already in a clear downtrend providing us with short opportunities at monthly imbalance around 12 per share. As expected price sold off strongly from that imbalance and has ended up created another huge imbalance around 11.39 per share.

Should you buy TUI share right now?
Yes. Now, we are expecting to see price do the exact opposite.

We expect TUI AG German stock to start rallying again as the stock is now very cheap. There is a lot of profit margin to reach the upper imbalance. This is a stock we are watching closely, a nice candidate for long term longs available right now.

Attached Image (click to enlarge)
Click to Enlarge

Name: Screenshot1.png
Size: 105 KB


TUI Group Tour Operator forecast 2020
Set and Forget supply and demand trading community
 
 
  • Post #9,630
  • Quote
  • Jun 12, 2020 3:05am Jun 12, 2020 3:05am
  •  panoramia
  • | Commercial Member | Joined Aug 2011 | 3,525 Posts
USD JPY clear scenario
If you are a Forex intraday trader or scalper, you might have seen a few of your USDJPY short positions fail, why? Because a big force like the one seen on USDJPY around 101 will eliminate small chunks of sell orders on the way up. Every candlestick in USDJPY Forex cross pair technical analysis below represents a monthly of time. You can use other strategies to go long on USDJPY, even those strategies that use indicators. We don’t need any of that as supply and demand traders.

Attached Image (click to enlarge)
Click to Enlarge

Name: Screenshot1.png
Size: 131 KB


Supply and demand Forex trading strategy
Set and Forget supply and demand trading community
 
 
  • Post #9,631
  • Quote
  • Jun 16, 2020 10:58am Jun 16, 2020 10:58am
  •  panoramia
  • | Commercial Member | Joined Aug 2011 | 3,525 Posts
EURNOK Forex cross pair (Euro versus Norwegian Krone) broke all time high again after months. EURNOK is trying to recover from the worst drop it had in a few decades.

As explained in previous analysis EURNOK recovering from the worst drop in a few decades, we discussed the reasons why Norway’s Krone suffered the worst drop in half a century. Our supply and demand Forex analysis told us that a strong imbalance was in the making and that going long after such a strong rally was not allowed, we had to wait for a pullback and that’s exactly what has happened on EURNOK Forex cross pair. As short term traders you could have sold all the way down to the strong imbalance pointed out in the analysis, but once the Weekly imbalance takes control, only longs are possible.

Expected big retracement on EUR NOK happened
As expected, EURNOK dropped to drop all the way down to the origin of the more to a strong weekly imbalance located around 10.50. As a short term trader trading intraday on Forex, you will be able to go trade short all the way down if forex selling signals start to happen. Longs would have been possible at the imbalance indicated in the previous supply and demand technical analysis for EURNOK Forex cross pair. See the updated technical analysis below and compare it with previous EURNOK Forex cross pair forecast.

Attached Image (click to enlarge)
Click to Enlarge

Name: eurnok demand imbalance analysis.jpg
Size: 91 KB


Supply and demand Forex trading strategy
Set and Forget supply and demand trading community
 
 
  • Post #9,632
  • Quote
  • Jun 18, 2020 4:24am Jun 18, 2020 4:24am
  •  panoramia
  • | Commercial Member | Joined Aug 2011 | 3,525 Posts
Bank Nifty managed to broke all time high has broken all time highs last December 2019 but covid-19 fear shuttered the progress the index had made in previous months creating one of the strongest bearish impulses in many years.

As supply and demand traders we must not sell after a very strong bearish impulse, it goes against the core concepts of supply and demand theories. There is a lot of room for Bank Nifty index to reach the weekly supply around 30200. Swing traders and intraday traders will have many opportunities to trade all the way up to that price level.

At Set and Forget trading community there are some Indian fellow traders that are long long term on Bank Nifty and Nifty 50 Index for various reasons explained in more detail in the trading community and the more advanced supply and demand concepts.

Higher probability Bank Nifty trading next weeks
It’s very important to trade these strong impulse in the context of a bigger picture trend and avoid trading counter trend scenarios. How can you buy Bank Nifty 50 futures or Nifty 50 related stocks in an uptrend? First of all you must look for impulses strong enough to create a series of wide candlestick bodies in the direction the of the long term trend. The Bank Nifty chart attached below represents the weekly timeframe. It shows a very strong bearish impulse to which price is being pulled.

Attached Image (click to enlarge)
Click to Enlarge

Name: Screenshot1.png
Size: 215 KB


Supply and demand Stocks and Forex trading strategy
Set and Forget supply and demand trading community
 
 
  • Post #9,633
  • Quote
  • Jun 19, 2020 9:51am Jun 19, 2020 9:51am
  •  panoramia
  • | Commercial Member | Joined Aug 2011 | 3,525 Posts
USDCAD Forex cross pair monthly supply level around 1.35 is now in control, sell opportunities are being formed at new daily supply imbalances. There is a very strong bearish impulse that managed to create a brand new supply level on the daily chart around 1.3595. Longs are not allowed on USDCAD with monthly supply level in control.

USDCAD forex cross pair analysis and forecast
Sell opportunity formed at the daily supply level if price ever retraces up there and the market conditions have not changed when price reaches that supply level around 1.3595

The Canadian Dollar is usually highly correlated to crude oil prices since Canada is a important player. Conventional crude oil production has remained stable at about 1.5 million barrels per day. The 5 largest companies (Suncor, Canadian Natural Resources Limited, Imperial Oil, Husky and Cenovus) are responsible for over half of crude oil production in Canada.

Canada, the country best known for maple leafs and moose also produces vast quantities of oil. In fact, despite having less than .5% of the world’s population, Canada produces well over 4% of world production. Canada is well-placed to continue for the indefinite future: much of the current reserves are in tar sands, meaning that the oil is more costly to separate from the ground. As technology improves, Canada will be able to capitalize on these reserves–not to mention any that may be revealed as Arctic sea ice retreats. Its reserves of 180 billion barrels are third-most in the world.

Attached Image (click to enlarge)
Click to Enlarge

Name: usdcad forex demand imbalance analysis.jpg
Size: 108 KB


Supply and demand Stocks and Forex trading strategy
Set and Forget supply and demand trading community
 
 
  • Post #9,634
  • Quote
  • Jun 23, 2020 3:41am Jun 23, 2020 3:41am
  •  panoramia
  • | Commercial Member | Joined Aug 2011 | 3,525 Posts
As explained in a previous analysis “Apple maintains lead with smartwatches or without them” and a few others in the past together with the updated video analysis on my YouTube channel, we expected price to break all time highs after reaching a very strong imbalance and that’s exactly what Apple Inc (NASDAQ: AAPL) has accomplished.

A new weekly imbalance is in the making on Apple Inc (NASDAQ: AAPL) after breaking the all time high barrier around $330 per share. The stock is seems to be unstoppable, great for stock intraday trading and stock swing trading strategies. You can use this Apple supply and demand analysis to plan trades using other stock trading strategies that use smaller timeframes to enter a trade, even stock trading strategies that use indicators and oscillators.

If you want to view more analysis like Apple you can visit our Stock market study page.

Take a look at the updated Apple Inc (NASDAQ: AAPL) supply and demand technical analysis below.
Attached Image (click to enlarge)
Click to Enlarge

Name: Screenshot1.png
Size: 175 KB


Supply and demand Stocks and Forex trading strategy
Set and Forget supply and demand trading community
 
 
  • Post #9,635
  • Quote
  • Jun 24, 2020 10:17am Jun 24, 2020 10:17am
  •  panoramia
  • | Commercial Member | Joined Aug 2011 | 3,525 Posts
USD NOK Forex cross pair (American Dollar versus Norwegian Krone) broke all-time highs after months. USD NOK is trying to recover from the worst drop it had in a few decades. As explained in a similar technical supply and demand analysis for EUR/NOK at EURNOK recovering from the worst drop in a few decades, we discussed the reasons why Norway’s Krone suffered the worst drop in half a century.

Our supply and demand Forex analysis told us that a strong imbalance was in the making and that going long after such a strong rally was not allowed, we had to wait for a pullback and that’s exactly what has happened on several NOK Forex cross pairs including USDNOK.

As short term traders you could have sold all the way down to the strong imbalance pointed out in the analysis. But once the Weekly imbalance takes control, only longs are possible.

Expected big retracement on USD NOK happened
As expected, USDNOK dropped to drop all the way down to the origin of the more to a strong weekly imbalance located around 9.38. As a short term trader trading intraday on Forex, you will be able to go trade short all the way down if forex selling signals start to happen. Longs would have been possible at the imbalance indicated in the previous supply and demand technical analysis for USDNOK Forex cross pair.

Attached Image (click to enlarge)
Click to Enlarge

Name: Screenshot1.png
Size: 104 KB


Supply and demand Stocks and Forex trading strategy
Set and Forget supply and demand trading community
 
 
  • Post #9,636
  • Quote
  • Jun 26, 2020 4:01am Jun 26, 2020 4:01am
  •  panoramia
  • | Commercial Member | Joined Aug 2011 | 3,525 Posts
The SPDR S&P 500 trust SPY, is an exchange-traded fund or ETF which trades on the NYSE Arca under the symbol. SPDR is an acronym for the Standard & Poor’s Depositary Receipts, the former name of the ETF. It is designed to track the S&P 500 stock market index. This fund is the largest ETF in the world.

SPDR S&P 500 ETF trust
As supply and demand traders technical analysts we can see a demand imbalance at #1 around $297 that took control. There is a lot of room for SPDR S&P 500 SPY to rally much higher and reach weekly supply imbalance at #2 around $332. Price action is telling us a lot of things as traders, we expect that level to be eliminated in the forthcoming weeks. A similar scenario was predicted for QQQ Nasdaq ETF and that’s what happened exactly.

SPDR chart analysis
As supply and demand traders there is a long term uptrend and bullish bias. As short term traders and day traders you can use this supply and demand technical analysis and forecast for 2020 to enter longs in the lower timeframes. You can use other stock and ETF trading strategies to trade SPY and any exchange-traded fund or ETF.

Attached Image (click to enlarge)
Click to Enlarge

Name: Screenshot1.png
Size: 355 KB


Supply and demand Stocks and Forex trading strategy
Set and Forget supply and demand trading community
 
 
  • Post #9,637
  • Quote
  • Jul 3, 2020 3:32am Jul 3, 2020 3:32am
  •  panoramia
  • | Commercial Member | Joined Aug 2011 | 3,525 Posts
GBP/USD British Pound versus US dollar has got a new demand imbalance around 1.2296 price level which is helping price to rally higher into a bigger timeframe supply imbalance to which price reacted already three weeks ago, around 1.18 price level.

You can use this GBPUSD Forex major supply and demand technical analysis to plan longs using other Forex trading strategies or lower and faster timeframes. As an intraday trader trading Forex you should not trade against a bigger timeframe weekly imbalance, you should place your Forex trades in the direction of the imbalance and not against it.

See below GPB/USD weekly Forex cross pair supply and demand analysis where those two price levels and imbalances are drawn.

Attached Image (click to enlarge)
Click to Enlarge

Name: Screenshot1.png
Size: 129 KB


Supply and demand Stocks and Forex trading strategy
Set and Forget supply and demand trading community
 
 
  • Post #9,638
  • Quote
  • Jul 15, 2020 1:16am Jul 15, 2020 1:16am
  •  panoramia
  • | Commercial Member | Joined Aug 2011 | 3,525 Posts
As explained in Set and Forget’s trading community, we were expecting a strong rally and all-time highs being broken and that’s exactly what has happened on PowerShares Nasdaq QQQ. take a look at the weekly timeframe price action analysis below, we are expecting PowerShares Nasdaq QQQ to break the $249 mark any time soon.

Attached Image (click to enlarge)
Click to Enlarge

Name: Screenshot0.png
Size: 298 KB

Supply and demand Stocks and Forex trading strategy
Set and Forget supply and demand trading community
 
 
  • Post #9,639
  • Quote
  • Jul 22, 2020 10:33am Jul 22, 2020 10:33am
  •  panoramia
  • | Commercial Member | Joined Aug 2011 | 3,525 Posts
As expected and mentioned in previous EURUSD Forex technical analysis and forecast a few more weeks back, a very strong monthly imbalance gained control on EURUSD last March 2020 around 1.0654 and it has not stopped rallying ever since. As explained in previous EURUSD technical analysis, we had a strong bearish bias but once a strong imbalance on a big timeframe like the monthly takes control, trading shorts is a bit of suicidal behaviour.


Attached Image (click to enlarge)
Click to Enlarge

Name: Screenshot0.png
Size: 102 KB


Supply and demand Stocks and Forex trading strategy
Set and Forget supply and demand trading community
 
 
  • Post #9,640
  • Quote
  • Jul 24, 2020 1:58am Jul 24, 2020 1:58am
  •  panoramia
  • | Commercial Member | Joined Aug 2011 | 3,525 Posts
AUDUSD forex cross pair is rallying strongly and created a longer-term new weekly demand imbalance around 0.65 price area. There is a clear uptrend so if you are a shorter term or even a longer-term trader, only longs are possible on AUDUSD forex cross pair.

You can use this longer-term trading analysis for AUDUSD to plan your trades as an intraday Forex trader. As a swing Forex trader, you can use this longer-term supply and demand analysis to plan trades that you can hold for a longer period of time. By doing so, you will increase your profits. Do not think in pip terms, think of percentage.

Attached Image (click to enlarge)
Click to Enlarge

Name: audusd forex strong imbalance.png
Size: 109 KB


Supply and demand Stocks and Forex trading strategy
Set and Forget supply and demand trading community
 
1
  • Commercial Content
  • /
  • Supply and demand in a nutshell by Alfonso Moreno
  • Reply to Thread
    • 1 480481Page 482483484 486
    • 1 Page 482 486
1 trader viewing now
  • More
Top of Page
  • Facebook
  • Twitter
About FF
  • Mission
  • Products
  • User Guide
  • Media Kit
  • Blog
  • Contact
FF Products
  • Forums
  • Trades
  • Calendar
  • News
  • Market
  • Brokers
  • Trade Explorer
FF Website
  • Homepage
  • Search
  • Members
  • Report a Bug
Follow FF
  • Facebook
  • Twitter

FF Sister Sites:

  • Metals Mine
  • Energy EXCH
  • Crypto Craft

Forex Factory® is a brand of Fair Economy, Inc.

Terms of Service / ©2022