• Home
  • Forums
  • Trades
  • News
  • Calendar
  • Market
  • Brokers
  • Login
  • Join
  • User/Email: Password:
  • 9:10pm
Menu
  • Forums
  • Trades
  • News
  • Calendar
  • Market
  • Brokers
  • Login
  • Join
  • 9:10pm
Sister Sites
  • Metals Mine
  • Energy EXCH
  • Crypto Craft

Options

Bookmark Thread

First Page First Unread Last Page Last Post

Print Thread

Similar Threads

Supply and Demand Zones 44 replies

Price movement as a function of Supply and Demand 43 replies

Supply and demand zones and EW principles 1 reply

How Markets Work, in a Nutshell! 32 replies

Demand and Supply 1 reply

  • Commercial Content
  • /
  • Reply to Thread
  • Subscribe
  • 5,247
Attachments: Supply and demand in a nutshell by Alfonso Moreno
Exit Attachments

Supply and demand in a nutshell by Alfonso Moreno

  • Last Post
  •  
  • 1 479480Page 481482483 486
  • 1 Page 481 486
  •  
  • Post #9,601
  • Quote
  • Mar 17, 2020 2:45am Mar 17, 2020 2:45am
  •  panoramia
  • | Commercial Member | Joined Aug 2011 | 3,525 Posts
The whole trading world is talking about the same thing, the US stock market crash 2020, which is also a worldwide stock market that affects every single world exchange.

Has the market crash in 2020 began because of the corona virus effect? Have the Oil war and OPEC and Russia decisions affected the crash? Well, they have obviously affected the sell off in most stocks, indexes and ETFs, but they are not the only reason why price is dropping so strongly.

US Stock market correction 2020
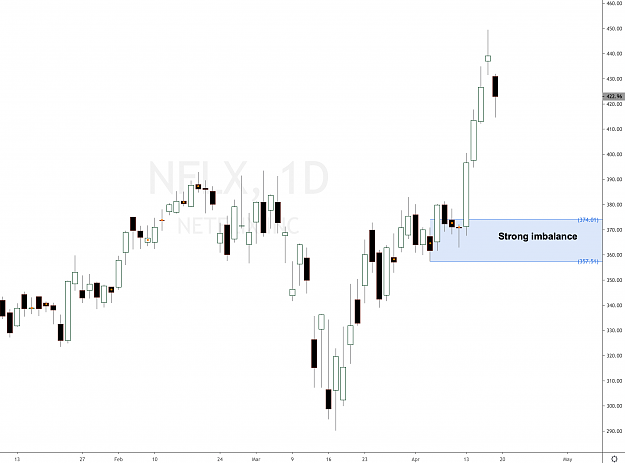
There are obvious reasons why corona virus could affect Norwegian Cruise Line (NCLH) stock, citizens cannot travel like before, many countries have banned other countries and flights are scarce or non-existent. The US has banned flight coming from the European Union and now even the UK, similar bans have been established in Spain, Italy, China and other countries. All this bans will undoubtedly cause a strong disruption in our travelling habits.

NYSE crash
Airlines and hotels are very much affected. I’ve many friends who have lost their jobs in Spain because of the effects of the corona virus. Many hotels have closed, restaurants have to be closed by order of our President. Employment rate will hit maximums in no time in Spain and probably in other countries whose Gross Domestic Product (GDP) is mostly focused on the services sector (hotels, restaurants, travelling).

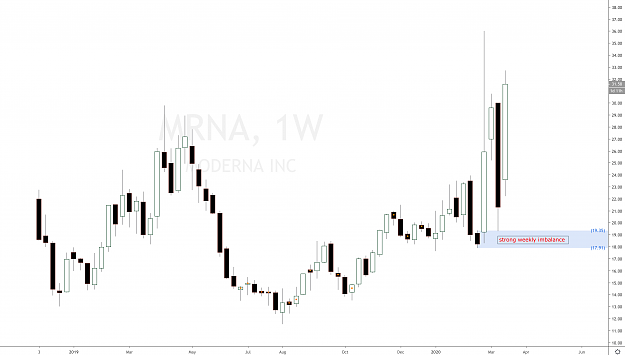
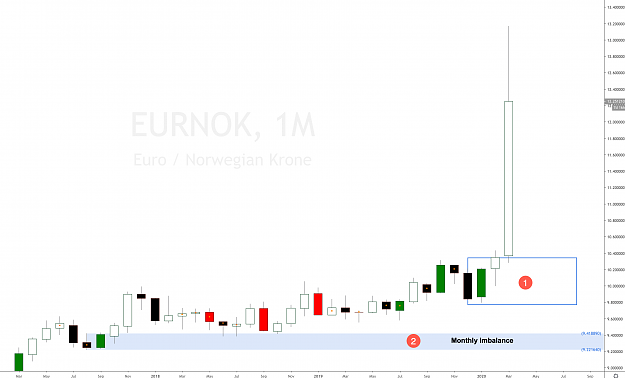
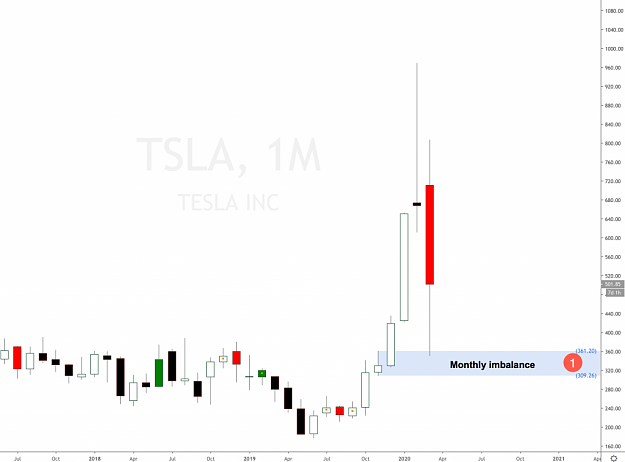
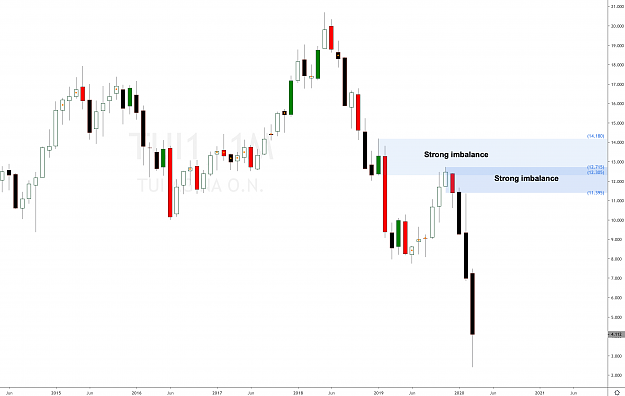
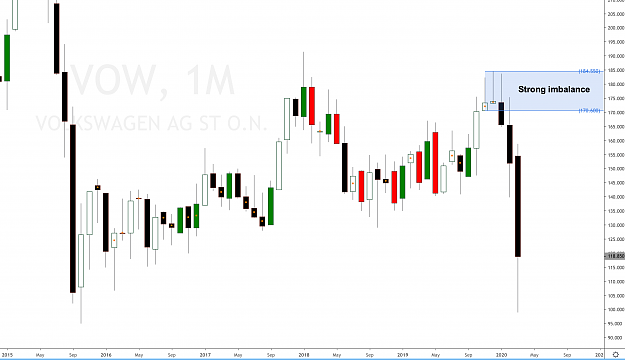
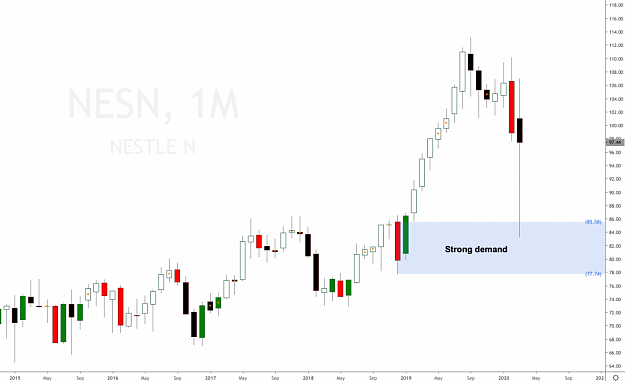
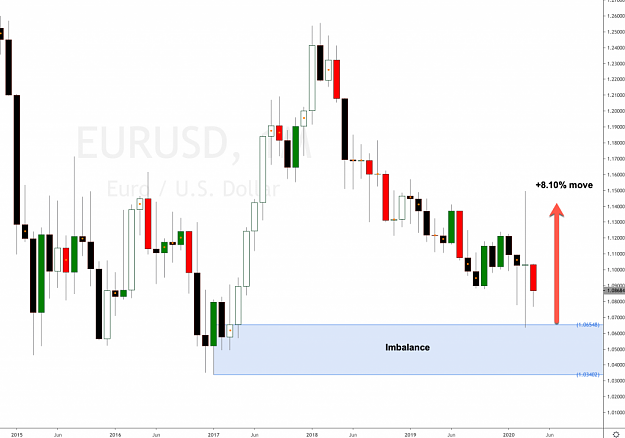
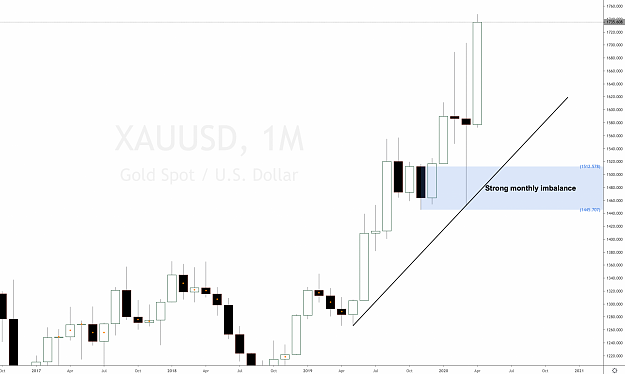
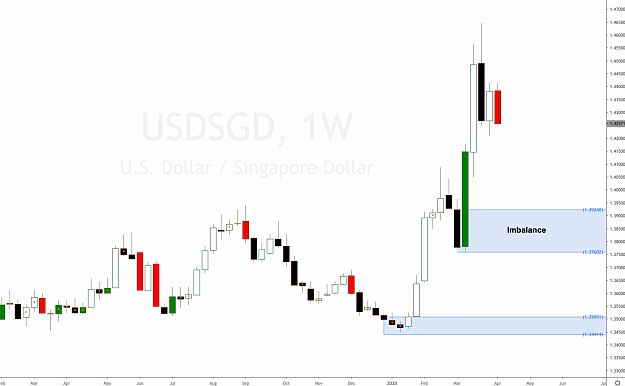
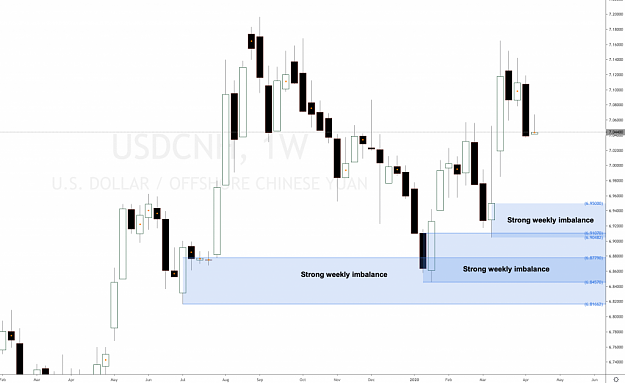
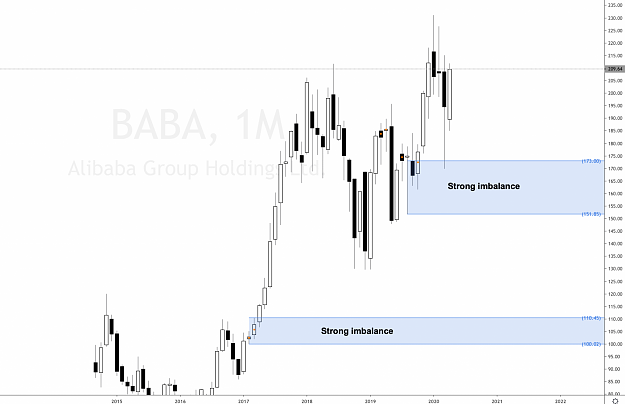
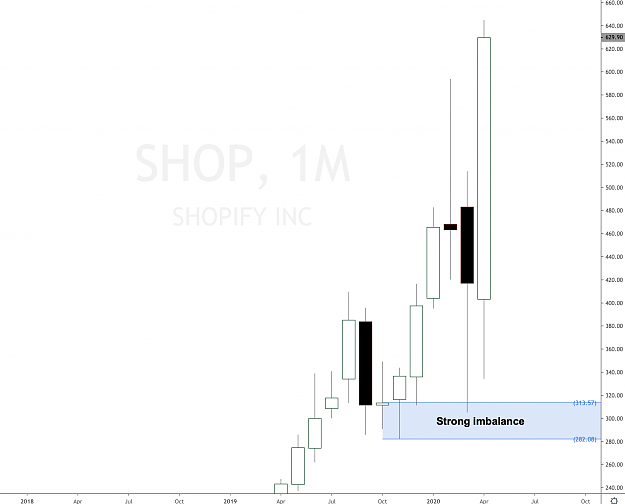
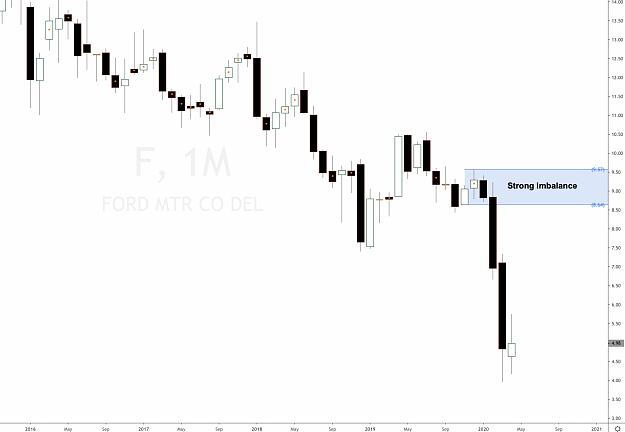
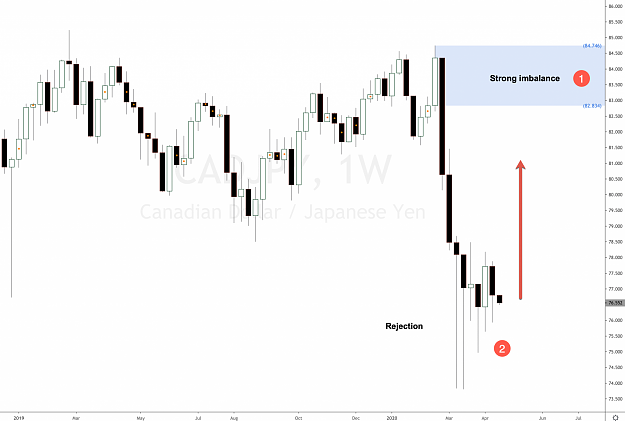
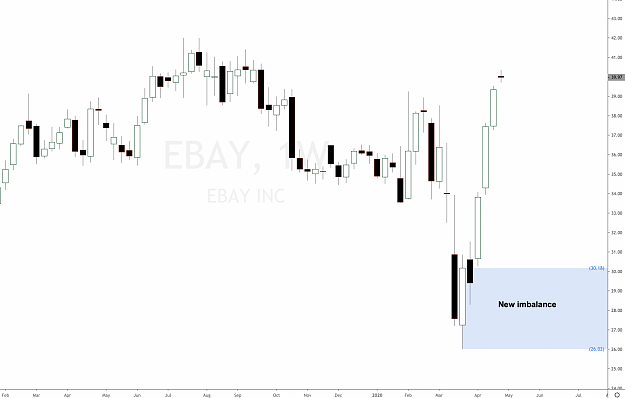
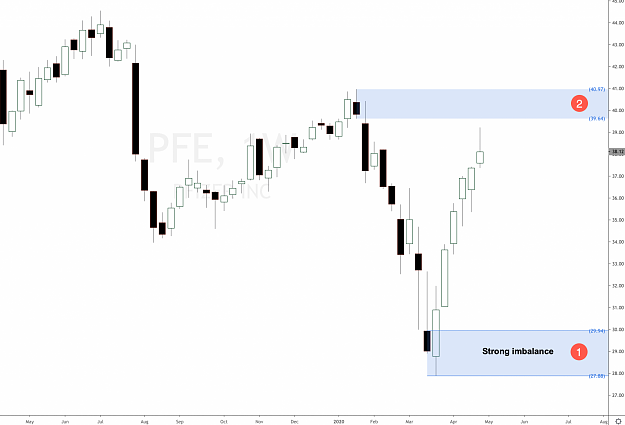
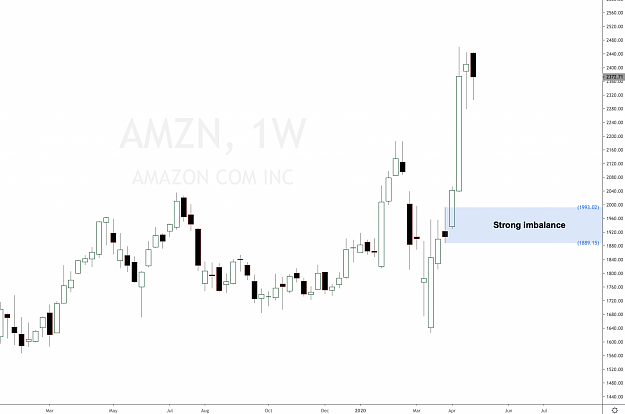
However we are forgetting something very important, price action itself and supply and demand. Price action is the only non-lagging indicator, if a candlestick closes at $45 on the daily, weekly or monthly timeframes, then the candle cannot unclose next day or week at a different close, it’s just impossible. The same cannot be said about indicators and oscillators, they change with sharp moves of the underlying asset and very high volatility like the one happening now in the US stock market crash 2020.

Inserted Video


US Stock market crash 2020
Set and Forget supply and demand trading community
 
 
  • Post #9,602
  • Quote
  • Mar 19, 2020 2:15pm Mar 19, 2020 2:15pm
  •  panoramia
  • | Commercial Member | Joined Aug 2011 | 3,525 Posts
The big story in biotechnology this past week has been the rise and fall of Moderna Biotechnology (MRNA) stock. As explained in a previous Moderna Biotech supply and demand stock analysis for the weekly timeframe a few days ago, we were expecting Moderna Biotech (MRNA) to retrace to weekly imbalance around $20 and that’s exactly what it has done.

Moderna Biotech (MRNA) stock forecast helped by coronavirus
The new coronavirus is affecting Moderna Biotech (MRNA) positively since they have been working in the creation of a cure and vaccine for coronavirus. Even if the vaccine Moderna Biotech works, there’s no real business model for vaccines that treat emerging viral threats like coronavirus. This is one of the major reasons why the pharmaceutical industry has generally not focused on these viruses. It is far from clear that Moderna could ever make money from its Covid-19 vaccine. I read from its CEO that the company wasn’t focusing on commercialization of the vaccine, he said that company only focus was public health.

That being said, take a look at what happened to Moderna Inc (MRNA) stock once price hits strong weekly demand imbalance. It kissed the level and reacted very strongly to it. Moderna stock price has moved 80% ever since, that’s a lot. See Moderna Biotech stock analysis in the screenshot below. The trade has already happened as expected, now it’s too late to buy Moderna Biotech.

Attached Image (click to enlarge)
Click to Enlarge

Name: moderna pharmaceuticals stock after.png
Size: 221 KB


Learn how to trade stocks using supply and demand imbalances
Set and Forget supply and demand trading community
 
 
  • Post #9,603
  • Quote
  • Mar 24, 2020 2:56am Mar 24, 2020 2:56am
  •  panoramia
  • | Commercial Member | Joined Aug 2011 | 3,525 Posts
EURNOK Forex cross pair (Euro versus Norwegian Krone) has broken all time high again after months. A previous monthly demand imbalance gained control last June 2018 and this cross pair has been rallying ever since.

Norway’s Krone Suffers Worst Drop in a few decades

Why has Norway’s Krone suffered the worst drop in half a century? Well, by doing supply and demand analysis on the monthly timeframe we can see that EURNOK forex cross pair was in a clear uptrend on. There is no reason to go short, only longs are possible by following the big picture monthly uptrend. We can see in the attachment a very strong monthly impulse around 10.35 at (1) that could eventually become an imbalance if price continues like that.

We don’t need to pay attention to Forex fundamental analysis if we are trading a supply and demand imbalances strategy and trading with the bigger picture trend. It’s taken for granted that if you trade the very small timeframes, fundamental analysis and news events will kick you out of the trade.

If you decide to read about Forex fundamental analysis, Norway’s central bank said it is ready to intervene after the bottom seemed to fall out of the krone market. The movements have been very large, the Norges Bank is considering whether they will intervene in the market by purchasing Norwegian Kroner.
Norway is western Europe’s biggest crude oil exported, it’s clearly being affected by the strong sell-off in crude oil prices.
All that can add an extra layer of complexity and also understanding to why EURNOK is rallying so strongly. The fact still remains though, monthly timeframe was and still is in an uptrend, new monthly imbalances being created with previous one in control. Fundamentals? You don’t really need them. The fury of the sell-off is unprecedented, but we knew that was going to happen by looking at the monthly timeframe and doing a supply and demand technical analysis.

Attached Image (click to enlarge)
Click to Enlarge

Name: eurnok forex forecast.png
Size: 252 KB

Learn how to trade stocks using supply and demand imbalances
Set and Forget supply and demand trading community
 
 
  • Post #9,604
  • Quote
  • Mar 26, 2020 4:16am Mar 26, 2020 4:16am
  •  panoramia
  • | Commercial Member | Joined Aug 2011 | 3,525 Posts
Analysts were saying that the coronavirus pandemic is going to hurt Tesla Inc (NASDAQ). They say that Tesla’s vehicle deliveries will be negatively impacted by the pandemic in 2020. Ahead of the outbreak, the analyst said he was modelling robust deliveries as consumers continued to flock to the Model S and Model X, as well as the Model 3.

Despite past production delays, parts shortages, labor cost overruns and other difficulties, Tesla (TSLA) was on track for improved performance in 2020 and beyond due to its dominant position in the electric vehicle industry.

Well, the coronavirus outbreak probably will hurt Tesla as well as thousand of others stocks in the whole world. In the meantime, supply and demand is playing its game with new strong imbalance in the monthly timeframe after breaking all time high.

Attached Image (click to enlarge)
Click to Enlarge

Name: Screenshot1.png
Size: 254 KB


Read full Tesla Stock analysis and forecast
Set and Forget supply and demand trading community
 
 
  • Post #9,605
  • Quote
  • Mar 30, 2020 8:31am Mar 30, 2020 8:31am
  •  panoramia
  • | Commercial Member | Joined Aug 2011 | 3,525 Posts
TUI AG is was already in a clear downtrend providing us with short opportunities at monthly imbalance around 12 per share. As expected price sold off strongly from that imbalance and has ended up created another huge imbalance around 11.39 per share.

We do not need to pay attention to stock fundamental analysis when trading supply and demand imbalances. Of course we can read about the company’s profile and even the big news but that should not prevent you from taking a valid trade using a supply and demand imbalance stock strategy.

HSBC has downgraded its investment rating on TUI AG, does that mean anything? Well, not really if we are supply and demand traders. We already know that the monthly timeframe has a bearish bias and new supply imbalances are being created. We should not care what HSBC or any other analysts say about TUI Ag stock, it will not change the fact that we have new strong imbalances. See TUI AG stock monthly timeframe forecast below.

Attached Image (click to enlarge)
Click to Enlarge

Name: tui tour operator stock forecast.png
Size: 213 KB


TUI Stock Analysis Forecast
Set and Forget supply and demand trading community
 
 
  • Post #9,606
  • Quote
  • Mar 31, 2020 12:13pm Mar 31, 2020 12:13pm
  •  panoramia
  • | Commercial Member | Joined Aug 2011 | 3,525 Posts
Like many other german and European automotive manufacturing companies, Volkswagen AG (VOW) stock analysis forecast is bearish, with monthly in a clear downtrend with a strong monthly imbalance located around 49 per share. There is not a single reason to buy shares of Volkswagen AG (VOW) stock, it would be suicidal right now.

This bearish forecast is being affected by COVID-19 coronavirus pandemia but the bearish bias was already present on Volkswagen AG (VOW) before the virus scared investors to death. Take a look at Volkswagen AG (VOW) monthly analysis and the strong supply imbalance located around 49 share price area.

Attached Image (click to enlarge)
Click to Enlarge

Name: volkswagen stock analysis forecast.png
Size: 202 KB


Learn how to trade stocks using supply and demand imbalances
Set and Forget supply and demand trading community
 
 
  • Post #9,607
  • Quote
  • Apr 8, 2020 3:40am Apr 8, 2020 3:40am
  •  panoramia
  • | Commercial Member | Joined Aug 2011 | 3,525 Posts
Nestlé S.A. is a Swiss multinational food and drink processing conglomerate corporation headquartered in Vevey, Vaud, Switzerland. It is the largest food company in the world, measured by revenues and other metrics, since 2014.

As expected and explained in a previous stock analysis for Nestle (NESN) stock, the stock has dropped all the way down to the strong monthly imbalance mentioned last August 2019. Going long after such a strong impulse on Nestle S.A (NESN) stock was not allowed as supply and demand traders. If you are an intraday trader you may have had losses trying to short the stock without being aware of the huge imbalance that was available in the monthly timeframe.

Attached Image (click to enlarge)
Click to Enlarge

Name: Screenshot1.png
Size: 221 KB


Learn how to trade stocks using supply and demand imbalances
Set and Forget supply and demand trading community
 
 
  • Post #9,608
  • Quote
  • Apr 13, 2020 2:25am Apr 13, 2020 2:25am
  •  panoramia
  • | Commercial Member | Joined Aug 2011 | 3,525 Posts
A strong monthly imbalance gained control on EURUSD last month around 1.0654. As explained in previous EURUSD forex cross pair analyses, we had a strong bearish bias but once a strong imbalance on a big timeframe like the monthly takes control, going short in smaller timeframes is not allowed and suicidal.

Euro Dollar forex pair analysis
Look at the strength of that monthly imbalance on EURUSD made of several strong wide candlestick bodies. EURUSD Forex cross pair has already reacted to that imbalance, it moved around 8.10% since price retraced to the imbalance last March 2020.

Potential long opportunities could be created in the next weeks, we need to put this imbalance into context and decide where and how we will trade EURUSD.

Attached Image (click to enlarge)
Click to Enlarge

Name: Screenshot1.png
Size: 238 KB


Learn how to trade Forex using supply and demand imbalances
Set and Forget supply and demand trading community
 
1
  • Post #9,609
  • Quote
  • Apr 15, 2020 1:48am Apr 15, 2020 1:48am
  •  panoramia
  • | Commercial Member | Joined Aug 2011 | 3,525 Posts
Gold XAUUSD price is widely followed in financial markets around the world. Gold was the basis of economic capitalism for hundreds of years until the repeal of the Gold standard, which led to the expansion of a flat currency system in which paper money doesn’t have an implied backing with any physical form of monetization.

XAU USD price analysis
When looking at XAUUSD Gold monthly timeframe we can see a monthly demand imbalance that was tested last March 2020. Gold has been rallying ever since and today finally broke monthly highest printed last month. Monthly is in a clear uptrend creating new demand and respecting, so the long term bias is bullish on Gold XAUUSD.

Learn how to trade futures using supply and demand imbalances
Attached Image (click to enlarge)
Click to Enlarge

Name: Screenshot1.png
Size: 1,014 KB
Set and Forget supply and demand trading community
 
 
  • Post #9,610
  • Quote
  • Apr 16, 2020 7:02am Apr 16, 2020 7:02am
  •  panoramia
  • | Commercial Member | Joined Aug 2011 | 3,525 Posts
Clear long bias on USDSGD (US dollar versus Singapore Dollar). This Forex cross pair forecast is bullish, given that we are having strong weekly demand imbalances created in the bigger timeframes like the weekly timeframe attached below.

USDSGD pair analysis
The USDSGD spot exchange rate specifies how much one currency, the USD, is currently worth in terms of the other, the SGD. While the USDSGD spot exchange rate is quoted and exchanged in the same day, the USDSGD forward rate is quoted today but for delivery and payment on a specific future date.

USDSGD Forex cross pair has been rallying for months creating two strong imbalances, long term directional bias on this cross pair is bullish. We don’t need any indicators to tell us that USDSGD if bullish as you can see in the monthly timeframe technical analysis below.

Attached Image (click to enlarge)
Click to Enlarge

Name: Screenshot2.png
Size: 991 KB


Learn how to trade Forex using supply and demand imbalances
Set and Forget supply and demand trading community
 
1
  • Post #9,611
  • Quote
  • Apr 17, 2020 1:04pm Apr 17, 2020 1:04pm
  •  panoramia
  • | Commercial Member | Joined Aug 2011 | 3,525 Posts
The official currency in China is the renminbi often abbreviated to RMB, while the term Yuan can be used to describe the base unit of the Chinese currency. When trading onshore it is referred to as CNY, while offshore trading is known as CNH.

USD CNH Chinese Yuan offshore forecast
This supply and demand analysis is done on USDCNH Chinese Yuan offshore. We’ve been following this Forex cross pair closely for the last weeks. We’ve seen how weekly demand imbalances were created and respected over the last months in a clear big picture long term bullish trend.

The US dollar is very strong against Chinese Yuan offshore currency pair, reason why last two weekly demand imbalances around 6.91 and 6.87 have been respected. There are a brand new imbalance slightly higher around 6.95 price level. Will this new imbalance be respected like the previous ones? We do not know but what we do know is that it’s a strong imbalance in a clear trend.
Attached Image (click to enlarge)
Click to Enlarge

Name: Screenshot1.png
Size: 235 KB


Learn how to trade Forex using supply and demand imbalances
Set and Forget supply and demand trading community
 
 
  • Post #9,612
  • Quote
  • Apr 20, 2020 10:10am Apr 20, 2020 10:10am
  •  panoramia
  • | Commercial Member | Joined Aug 2011 | 3,525 Posts
10-year T-note futures prices are moving higher after the International Monetary Fund (IMF) predicted the “Great Lockdown” will push the global economy this year into its deepest recession since the Great Depression. Slack U.S. price pressures also gave T-notes a boost today.

10 Year T Note price analysis
Well, what is the 10-Year T-Note Futures forecast based on supply and demand imbalances? Can we use a supply and demand strategy to trade 10 year T-Note futures as well? Of course we can. A few months ago we called a strong weekly imbalance created last July 2019 around 12729 price area. It two a few months but 10-Year T-Note Futures finally retraced to that imbalance last December 2019. Please see 10-Year T-Note Futures technical analysis below.

Attached Image (click to enlarge)
Click to Enlarge

Name: Screenshot1.png
Size: 1.0 MB


Learn how to trade Futures using supply and demand imbalances
Set and Forget supply and demand trading community
 
 
  • Post #9,613
  • Quote
  • Apr 21, 2020 1:11am Apr 21, 2020 1:11am
  •  panoramia
  • | Commercial Member | Joined Aug 2011 | 3,525 Posts
Netflix (NASDAQ: NFLX) has broken all time high after weeks of having the stock around $400 per share and unable to break that price area.

Last week Netflix (NASDAQ: NFLX) broke out in a strong bullish move that ended up creating a strong demand imbalance on the daily timeframe.

Netflix price chart analysis
Take a look at Netflix (NASDAQ: NFLX) daily timeframe analysis below, there is a strong imbalance created around $374 per share.

Attached Image (click to enlarge)
Click to Enlarge

Name: netflix nflx stock prediction .png
Size: 181 KB


Supply and demand stock trading stragegy
Set and Forget supply and demand trading community
 
 
  • Post #9,614
  • Quote
  • Apr 22, 2020 2:06am Apr 22, 2020 2:06am
  •  panoramia
  • | Commercial Member | Joined Aug 2011 | 3,525 Posts
Let’s take a look at Alibaba Group (NYSE: BABA) monthly timeframe with wearing our supply and demand glasses. Remember this is a long term analysis, you will be able to trade smaller timeframes on the way up or on the way down when it corrects.

Alibaba Group (NYSE: BABA) is one of the few companies that was not much affected by the crash of the market in March 2020. And this fact makes it particularly interesting to analyze the future prospects of the company.

Alibaba Group (NYSE: BABA) monthly timeframe is in a clear uptrend with new imbalances being created and respected. We were looking to go long long term at the first demand imbalance at the bottom of the chart around $110 per share but it failed short of retracing to it last January 2019. It’s a pity because it would have been a great opportunity. If we can say that the peak of the COVID-19 pandemic has passed, that is only in the case of China.

BABA price chart analysis
Alibaba Group (NYSE: BABA) continued to rally and ended up creating another imbalance last October 2019 around $173 where we were expecting price to pullback and react strongly despite the fear caused by COVID-19 coronavirus effect. Take a look at Alibaba Group (NYSE: BABA) analysis and forecast in the screenshot below.

Attached Image (click to enlarge)
Click to Enlarge

Name: Screenshot1.png
Size: 987 KB


Supply and demand stock trading stragegy
Set and Forget supply and demand trading community
 
 
  • Post #9,615
  • Quote
  • Apr 27, 2020 3:53am Apr 27, 2020 3:53am
  •  panoramia
  • | Commercial Member | Joined Aug 2011 | 3,525 Posts
Shopify long term bullish bias
Shopify (NYSE: SHOP) has broken all time high again after reacting to strong monthly imbalance created last January 2020 around 313 per share, where longs would have been possible again long term. Going short on Shopify (NYSE: SHOP) is not a good idea in a clear uptrend with such a strong imbalance and impulse in control. There are great opportunities formed in the smaller timeframes to buy Shopify (NYSE: SHOP).

Take a look at the monthly timeframe supply and demand technical analysis for Shopify (NYSE: SHOP). Shopify Inc. skyrocketed again last Monday, surpassing one of Canada’s largest banks to become the second-most valuable company on the nation’s stock market.

Attached Image (click to enlarge)
Click to Enlarge

Name: shopify stock analysis forecast.png
Size: 183 KB


Supply and demand stock trading strategy
Set and Forget supply and demand trading community
 
 
  • Post #9,616
  • Quote
  • Apr 28, 2020 10:18am Apr 28, 2020 10:18am
  •  panoramia
  • | Commercial Member | Joined Aug 2011 | 3,525 Posts
Ford Motor Company (NYSE: F) technical analysis forecast is clearly bearish. The stock has been dropping for many consecutive months and years providing short opportunities. Last February 2020 Ford Motor Company (NYSE: F) dropped even further creating a very strong bearish impulse after selling off for two months in a row.

Ford stock price chart analysis
A very strong imbalance has been created around $8 per share where shorts on Ford Motor Company (NYSE: F) will be possible again. Remember this is a long term analysis, take a look at Ford’s monthly supply and demand analysis below.

It doesn’t really mater if Ford’s CEO says that Ford Vehicles will have surfaces that ‘Puncture’ viruses. Does that really matter? Not really. There is a clear downtrend on Ford Motor stock, an antivirus car will not help at all.
Attached Image (click to enlarge)
Click to Enlarge

Name: Screenshot1.png
Size: 911 KB


Supply and demand stock trading strategy
Set and Forget supply and demand trading community
 
 
  • Post #9,617
  • Quote
  • Apr 29, 2020 3:38am Apr 29, 2020 3:38am
  •  panoramia
  • | Commercial Member | Joined Aug 2011 | 3,525 Posts
As of late the Japanese Yen hasn’t been providing much clues as to what it wants to do versus the US Dollar and other currency pairs, but that could change against other currencies as extended moves into supply imbalances, along with narrowing ranges threatens weakness. We are waiting more of a pullback on CADJPY Forex cross pair given the strength of the bullish pin candles seen on the weekly timeframe at #2. Take a look at CADJPY Forex cross pair supply and demand analysis for the weekly timeframe below.

CAD JPY chart price analysis
That does not mean we want to go long, those trading smaller timeframes, trading intraday can do that if price starts rallying again. Long term short bias, interested in shorts. But longs are possible now all the way up.

Attached Image (click to enlarge)
Click to Enlarge

Name: cadjpy.png
Size: 1.1 MB


Supply and demand Forex trading strategy
Set and Forget supply and demand trading community
 
1
  • Post #9,618
  • Quote
  • May 5, 2020 2:11am May 5, 2020 2:11am
  •  panoramia
  • | Commercial Member | Joined Aug 2011 | 3,525 Posts
Ebay chart price analysis
EBAY (NASDAQ: EBAY) e-commerce stock is soaring and creating strong imbalances like the new one on the weekly timeframe around $30 per share. EBAY stock ha a lot of potential to keep on rallying, new long opportunities are being created, the strongest one for long term investors can be see in the supply and demand analysis below.

EBAY ecommerce stock soaring
E-commerce companies like Ebay Inc (NASDAQ: EBAY) have emerged as a favorite play on Wall Street during the coronavirus pandemic, amid a growing consensus that upcoming results will reveal a potentially permanent shift in consumer behavior toward online shopping. This is not a new thing, the pandemic effect is just helping it.
Ebay can make new all times high

While online sales, especially those from Ebay Inc (NASDAQ: EBAY), have long been growing their market share as a percentage of overall retail spending, the trend has been accelerated because of the shutdowns. Analysts have said that the higher demand is likely to outlast the pandemic, especially in categories like groceries, which previously had less traction online.

The long term bias and forecast for Ebay Inc (NASDAQ: EBAY) is definitely bullish with strong bigger timeframe demand imbalances being created and respected.

Attached Image (click to enlarge)
Click to Enlarge

Name: Screenshot1.png
Size: 937 KB


Supply and demand Stocks trading strategy
Set and Forget supply and demand trading community
 
 
  • Post #9,619
  • Quote
  • May 7, 2020 8:57am May 7, 2020 8:57am
  •  panoramia
  • | Commercial Member | Joined Aug 2011 | 3,525 Posts
Pfizer PFE chart price analysis
Pfizer Inc. (NYSE: PFE) pharmaceutical drug manufacturar company has a tricky price action on the weekly timeframe. As longer term traders we can see a strong bullish impulse and imbalance at the bottom around $30 per share where we are interesting in buying shares of Pfizer Inc. (NYSE: PFE) stock. After a strong impulse we must wait for a retracement and correction so we can get the underlying stock at a better price right at or within an imbalance.

Pfizer price analysis
There is a weaker imbalance a little bit higher around $39 per share, right where you can see #2 in red which could provide a bigger pullback and correction.

Attached Image (click to enlarge)
Click to Enlarge

Name: Screenshot1.png
Size: 946 KB


Supply and demand Stocks trading strategy
Set and Forget supply and demand trading community
 
 
  • Post #9,620
  • Quote
  • May 8, 2020 11:15am May 8, 2020 11:15am
  •  panoramia
  • | Commercial Member | Joined Aug 2011 | 3,525 Posts
Amazon (NASDAQ: AMZN) is soaring again breaking all time high and currently trading at exorbitant prices around $2372 per share. We can see how that strong weekly demand imbalance has been created around $1993, very close to the $2000 price level. There is a clear long term long bias on Amazon with new demand imbalances being created and respected. The coronavirus correction that happened for two months is now left behind leaving us with a renewed long bias and strong imbalances to go long at.

We don’t need fundamental analysis to make a trading decision on Amazon stock, but if you still want to learn some fundamentals about the company and its earnings, read below.

Amazon.com reports first-quarter earnings after the close of trading on Thursday, and expectations on Wall Street are running sky high. With many millions of people sheltering in place, the e-commerce giant has been deluged with demand. Early in the crisis, the company announced plans to hire 100,000 extra workers. A few weeks later, those slots filled, Amazon announced plans to hire 75,000 more.

Attached Image (click to enlarge)
Click to Enlarge

Name: Screenshot1.png
Size: 889 KB


Supply and demand Stocks trading strategy
Set and Forget supply and demand trading community
 
 
  • Commercial Content
  • /
  • Supply and demand in a nutshell by Alfonso Moreno
  • Reply to Thread
    • 1 479480Page 481482483 486
    • 1 Page 481 486
1 member viewing:
Invisible
  • More
Top of Page
  • Facebook
  • Twitter
About FF
  • Mission
  • Products
  • User Guide
  • Media Kit
  • Blog
  • Contact
FF Products
  • Forums
  • Trades
  • Calendar
  • News
  • Market
  • Brokers
  • Trade Explorer
FF Website
  • Homepage
  • Search
  • Members
  • Report a Bug
Follow FF
  • Facebook
  • Twitter

FF Sister Sites:

  • Metals Mine
  • Energy EXCH
  • Crypto Craft

Forex Factory® is a brand of Fair Economy, Inc.

Terms of Service / ©2022