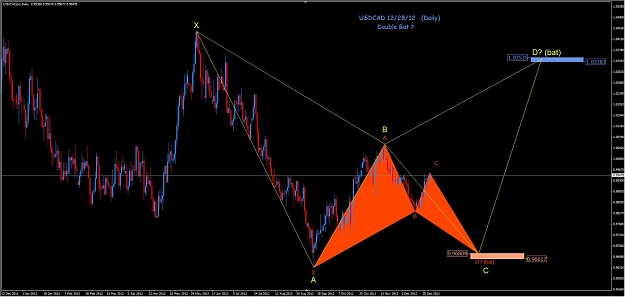
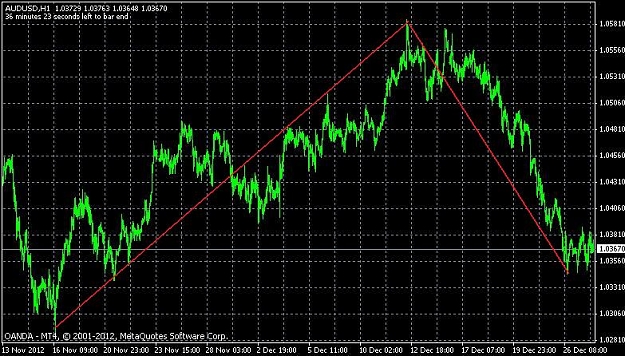
As per your chart, isnt point B and point C also dominant swing since this swing high and lows are also within main swing too ? you have mentioned swings between A&B , C&D as dominant swings, but why not B&C ?
DislikedI think now is a good time to discuss swings. We will not get into counting waves as these patterns do not call for this type of analysis. I believe wave may add value in adding further confirmation but it is not required to identify the patterns we will be looking at.
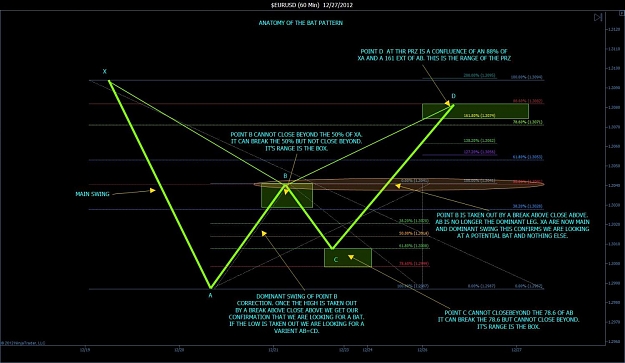
[font=Calibri][size=3]We look for price to be within a high and a low of a swing this is what I refer to a dominant swing. We also look for sore thumb high and a low. I refer to this as the main swing and always have the dominant swing within...Ignored