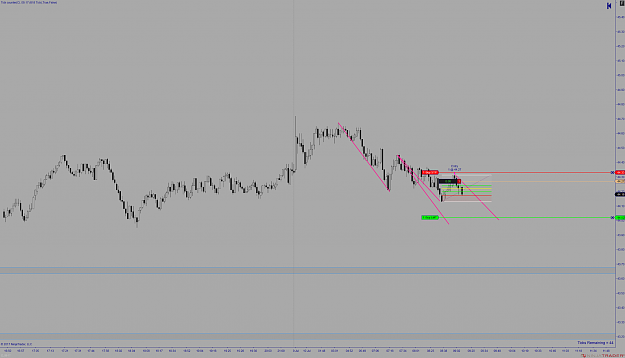
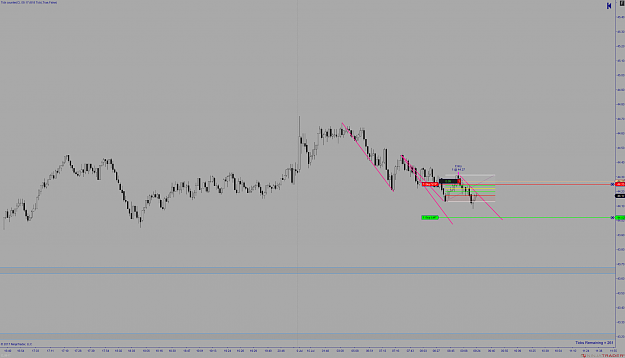
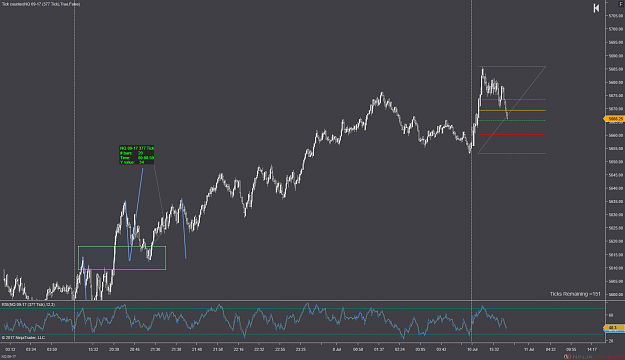
Disliked{quote} I am not Jmezz but i'd like to offer some of my observations as i think they may help you understand why his trade had a high probability to succeed IMO. I am using MT4 and the CDF for Dow on a 15 min interval as i am not on my usual trading computer where i can use Ninja/Futures YM. Pretty close to it anyway. Longer term view {image} Close up view {image} The key point to note is when price broke above the open with strength and the pullback to test the open on diminushing volume. In proportion to the strength we can conclude the bears...Ignored
Hello crixus thanks for your view on this.
I'm still learning and I really appreciate every comment and opinion.
Very interesting how you identified that range and the above-below zones.
I remember looking at this longer term picture before the start of the session and all I saw was messy orderflow with no clear NSLs or NSHs.
This sheds a different light on it :-)
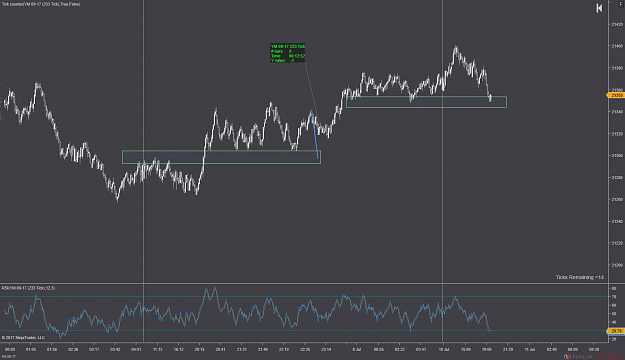
Second picture
I have difficulties interpreting the volume bars in conjunction with the candles, and deriving the conclusion that the bears are not interested.
I do see the first candle of your selected period in the volume section is a large pinbar with high volume, indicating (to me) that there was a lot of selling but price got pushed back all the way up, indicating a lot of strength from the bulls.
Then the volume diminishes. But that volume consists of buyers and sellers, so both buyers and sellers are diminishing in volume, right? And since price is going down I'd say that in this diminishing volume the bears had the upperhand?
It is not until I see the bullish candle bouncing off the open on high volume that I conclude the bulls are serious?
Tell me where I'm wrong thanks :-)