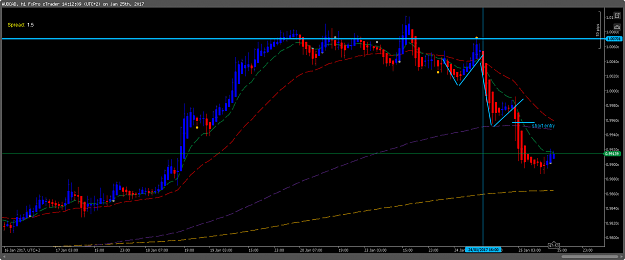
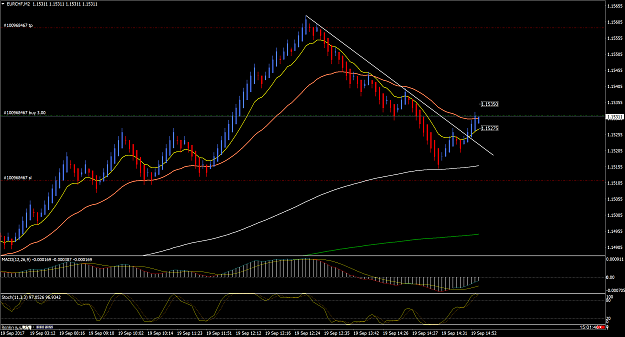
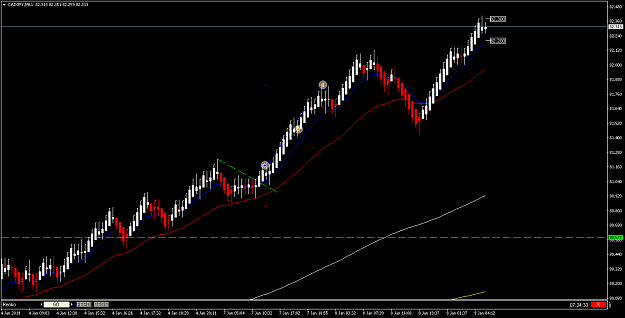
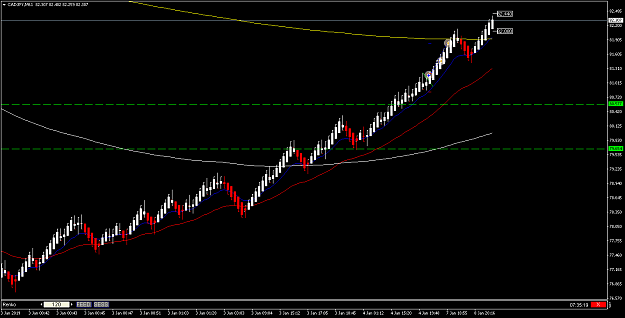
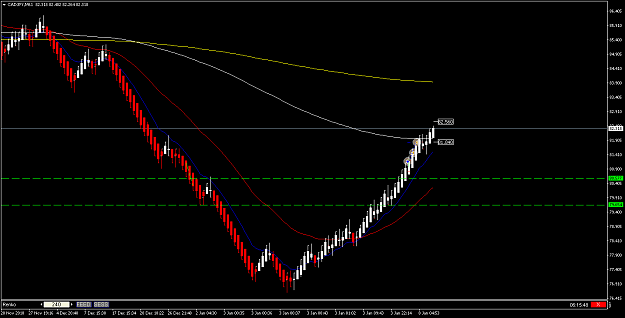
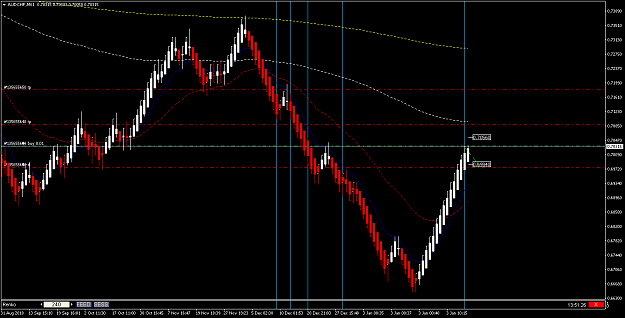
• Home
  • Forums
  • Trades
  • News
  • Calendar
  • Market
  • Brokers
  • Login
  • Join
  • User/Email: Password:
  • 11:14pm
Menu
  • Forums
  • Trades
  • News
  • Calendar
  • Market
  • Brokers
  • Login
  • Join
  • 11:14pm
Sister Sites
  • Metals Mine
  • Energy EXCH
  • Crypto Craft

Options

Bookmark Thread

First Page First Unread Last Page Last Post

Print Thread

Similar Threads

Are you a trend trader or a counter-trend trader? 29 replies

from retail trader to full-time trader 17 replies

Discipline Trader and Voice Trader EA/IND 16 replies

An Easy System (With the help of ES Trader - Another Simple System) 13 replies

IkonFX Viking Trader or Pfgbest Viking Trader? 2 replies

  • Commercial Content
  • /
  • Reply to Thread
  • Subscribe
  • 238
Attachments: The Spartan Trader FX System
Exit Attachments
Tags: The Spartan Trader FX System
Cancel

The Spartan Trader FX System

  • Last Post
  •  
  • 1 56Page 789 16
  • 1 6Page 78 16
  •  
  • Post #121
  • Quote
  • Jan 25, 2017 2:27am Jan 25, 2017 2:27am
  •  falkenboi
  • | Commercial Member | Joined Mar 2014 | 59 Posts
Quoting GregT
Disliked
SETUPS I OBSERVED TODAY WITH BEST POTENTIAL FOR AN ENTRY TRIGGER: CHFJPY Long - see a H4 setup formed yesterday on bounce off 200eMA with confluence from price not Opening below the D1 633/36. D1 setup formed last week. Tried to enter on M5 while price was pulling back but timing was out so did not achieve optimum entry USDJPY Short - seeing H4 setup today with potential for short trade while price retraces 400+ pips to the D1 200eMA USDCAD Short - D1 S123 setup formed this week and Xover...
Ignored
hi greg i agree with your usdjpy and usdcad setting , but chfjpy didnt make a long 123 in h4 .
>>> Trade like nobody is watching
 
1
  • Post #122
  • Quote
  • Jan 25, 2017 7:38am Jan 25, 2017 7:38am
  •  MasterJedi
  • | Joined May 2016 | Status: rollin & pipin | 379 Posts
Quoting GregT
Disliked
{quote} MJ, what was the reasoning for the setup you are observing? I can obviously see similar things in my chart to what you have posted but the absence of an explanation of what you are seeing does not help me correlate your thoughts with what I think I am seeing. I currently see price on AUDCAD as paused at a previous R-level that I can see you have marked on your chart, but rather than a short trade I was thinking it is more likely to go long after a pullback to the H4 200-633 or the MN 633 / WK 200 levels around 9820-9875 before resuming its...
Ignored
Hi Greg, I'll try to explain why I was interested in this chart. Every time price reaches a key level (daily+) it should be of interest. The chart below is 4hr, the vertical line is where I spotted this yesterday. The question is which way is it going?

Attached Image (click to enlarge)
Click to Enlarge

Name: 4hr.png
Size: 40 KB


Since the 4hr was going south I switch to 1hr & wait for a retracement 123 as you can see below. At this stage we have a better understanding of where price is heading which is south.

Attached Image (click to enlarge)
Click to Enlarge

Name: 1hr.png
Size: 43 KB


At this time though price could well retrace back to the 32ema because from resistance it dropped very quickly & will need to refuel if it still wants to head south, back to key support level. Of course it might well decide that this move south was simply a correction to refuel in order to break the resistance level. But we will know more once the heiken ashi changes colour.

I would appreciate any feedback in order to help me improve. I don't know if what I'm doing is the proper way so any advise is welcome. Also please note that I didn't take this trade because I was busy with AU which went well. Like you I only have a small account to learn so I have to watch the margin.

peace out
who dares wins
 
1
  • Post #123
  • Quote
  • Jan 30, 2017 5:12am Jan 30, 2017 5:12am
  •  falkenboi
  • | Commercial Member | Joined Mar 2014 | 59 Posts
Nice swing trading setup on nzdcad . DAily 123 H4 123 and H1 123 formed . looking for an entry in renko bar.
Attached Image (click to enlarge)
Click to Enlarge

Name: 2017-01-30 15_38_58-Greenshot.jpg
Size: 223 KB
>>> Trade like nobody is watching
 
 
  • Post #124
  • Quote
  • Feb 22, 2017 4:28am Feb 22, 2017 4:28am
  •  GregT
  • | Joined Dec 2010 | Status: Member | 86 Posts
I am no longer posting here as I am focused on learning about FX trading with renko bars
 
 
  • Post #125
  • Quote
  • Jun 7, 2017 11:58am Jun 7, 2017 11:58am
  •  gopal33200
  • | Joined May 2017 | Status: Member | 131 Posts
Quoting GregT
Disliked
I am no longer posting here as I am focused on learning about FX trading with renko bars
Ignored

i need to join with you
 
 
  • Post #126
  • Quote
  • Sep 19, 2017 7:21am Sep 19, 2017 7:21am
  •  mtharwat
  • Joined Aug 2015 | Status: Member | 978 Posts
Hello dear tarders,

I hope this thread is not dead.
I just bought USD CHF based on Renko (10 pips) bricks.
Attached Image (click to enlarge)
Click to Enlarge

Name: USDCHFM2.png
Size: 106 KB
 
 
  • Post #127
  • Quote
  • Sep 19, 2017 7:26am Sep 19, 2017 7:26am
  •  mtharwat
  • Joined Aug 2015 | Status: Member | 978 Posts
I also scalped in Asian session NZD/CHF with 2.5 pips of Renko. I exited with 10 pips in profit.

The idea was a break of the trend line and then a retest of the EMAs (a pull back).
Attached Image (click to enlarge)
Click to Enlarge

Name: NZDCHFM2.png
Size: 185 KB
 
 
  • Post #128
  • Quote
  • Sep 19, 2017 8:07am Sep 19, 2017 8:07am
  •  mtharwat
  • Joined Aug 2015 | Status: Member | 978 Posts
bought EUR CHF on 2.5 pips. (Price is not totally above 12 EMA).
Attached Image (click to enlarge)
Click to Enlarge

Name: EURCHFM2.png
Size: 120 KB
 
 
  • Post #129
  • Quote
  • Sep 19, 2017 8:32am Sep 19, 2017 8:32am
  •  mtharwat
  • Joined Aug 2015 | Status: Member | 978 Posts
If any trader intends to use renko in his analysis, he can explore with different box sizes, same as we do the top down approach of time charts.

If lets say on 40 pips, price is in a range or in H4 price is bouncing between two horizontal lines, then we at least know where the direction of the trend is.

Then keep reducing box sizes on renko until you find a trend line and a 1, 2, 3.

With Renko (or even smaller time frames) you will also find micro trends within bigger cycles. If you can identify the boundaries or the limits to where your target and stoploss should be, you can easily trade.

EXample:

Lets say price in 40 pip renko box is just bouncing off support/resistance and formed two bricks, then keep reducing the box size to 10 or 5 until you find a trend line and 1 23. And be realistic with your targets.

I myself has been recently experiencing with spartan template and watched all the free videos online. I really like it and believe it is worth a try.

I hope I can encourage any other trader to share with me his experience and post as many examples as possible to keep this thread alive.
 
 
  • Post #130
  • Quote
  • Sep 19, 2017 11:04am Sep 19, 2017 11:04am
  •  mtharwat
  • Joined Aug 2015 | Status: Member | 978 Posts
Now my last trade for the night is EUR/GBP (mean renko)

On 80 pips, there is a clear rejection of resistance confirmed by macd divergence.

on 5 pips, i placed two pending orders to short the pair.

not sure about the timing as in the morning price may hover until london session starts again.

any way, it is demo and Iam experimenting with the template on offline charts.
Attached Image(s) (click to enlarge)
Click to Enlarge

Name: EURGBPM2.png
Size: 146 KB
Click to Enlarge

Name: EURGBPM2 (5 pips).png
Size: 151 KB
 
 
  • Post #131
  • Quote
  • May 25, 2018 8:45am May 25, 2018 8:45am
  •  rcbarlow
  • Joined Sep 2006 | Status: Member | 799 Posts
Why has this group died out? It is a great system, the only one I have been able to make money with.
 
 
  • Post #132
  • Quote
  • Nov 15, 2018 6:11am Nov 15, 2018 6:11am
  •  MTaufiq
  • | Joined Mar 2012 | Status: Alive and kicking | 28 Posts
Nikos Mermigas
1972 – 2018

Innalillahi wa inna ilaihi rojiun.
Rest in peace.

https://ci6.googleusercontent.com/pr...ef2ee613da.png
 
 
  • Post #133
  • Quote
  • Nov 15, 2018 8:08am Nov 15, 2018 8:08am
  •  rcbarlow
  • Joined Sep 2006 | Status: Member | 799 Posts
Sorry to hear that, but it doesn't mean everyone stopped trading the system.
 
 
  • Post #134
  • Quote
  • Nov 21, 2018 5:14pm Nov 21, 2018 5:14pm
  •  Akolva1
  • | Joined Apr 2017 | Status: Member | 78 Posts
Quoting rcbarlow
Disliked
Sorry to hear that, but it doesn't mean everyone stopped trading the system.
Ignored
The system is not dead but very much effective..I trade his system.
Nikos the founder of the system passed away recently. His fellow traders are keeping his website/strategy alive
https://www.nikostradingacademy.com
 
1
  • Post #135
  • Quote
  • Jan 8, 2019 11:05pm Jan 8, 2019 11:05pm
  •  mtharwat
  • Joined Aug 2015 | Status: Member | 978 Posts
Hello

I hope the thread picks up again.

I went long on CAD CHF based on Renko Only and not in combination with candlesticks.

My entry box size was 6 pips

Attached Image (click to enlarge)
Click to Enlarge

Name: CADCHF 6 pips.png
Size: 22 KB


On 12 Pips and 24 pips boxes, price structure was good and MAs looked good.

Attached Image (click to enlarge)
Click to Enlarge

Name: CADCHF12 pips.png
Size: 22 KB

Attached Image (click to enlarge)
Click to Enlarge

Name: CADCHF24 pips.png
Size: 23 KB


Stop loss was placed below the recent swing on 6 pips. I have two targets and will trail them

-----------
 
1
  • Post #136
  • Quote
  • Jan 8, 2019 11:11pm Jan 8, 2019 11:11pm
  •  mtharwat
  • Joined Aug 2015 | Status: Member | 978 Posts
EURAUD

I shorted the pair based on Renko only and not in combination with the time chart.

My entry box size was 12 pips.

Attached Image (click to enlarge)
Click to Enlarge

Name: EURAUD 12 pips.png
Size: 18 KB


The 48 renko box looks very bearish but price is currently on 200 EMA. Any way, I believe the bearishness will resume considering the small structure breakout on 12 pips box size and the touch of the 36 EMA.

The downfall for this trade would be no correction on Higher box sizes or corrections to the 36 EMA.

Attached Image (click to enlarge)
Click to Enlarge

Name: EURAUD 48 pips.png
Size: 20 KB
 
1
  • Post #137
  • Quote
  • Jan 9, 2019 12:37am Jan 9, 2019 12:37am
  •  mtharwat
  • Joined Aug 2015 | Status: Member | 978 Posts
I closed my position on CAD JPY long with good profit . (about 100 pips combined for two lots). (Only Renko Setup)

I closed my long based on 24 pip chart because of the 200 EMA on 24 pips and the 633 EMA on 12 pips. Price is still going up.

I entered on 6 pips chart with the breakout.


6 pips
Attached Image (click to enlarge)
Click to Enlarge

Name: CADJPYM61  6 pips.png
Size: 19 KB


12 pips .
Attached Image (click to enlarge)
Click to Enlarge

Name: CADJPYM61  12 pips.png
Size: 18 KB


24 pips .
Attached Image (click to enlarge)
Click to Enlarge

Name: CADJPY 24 pips.png
Size: 19 KB
 
 
  • Post #138
  • Quote
  • Jan 9, 2019 6:58am Jan 9, 2019 6:58am
  •  mtharwat
  • Joined Aug 2015 | Status: Member | 978 Posts
AUDCHF

I went long based on Renko Only.
Horizontal Lines are weekly separators (attached)

Attached File(s)
File Type: mq4 Weekly-Period-Separator-Indicator.mq4   2 KB | 209 downloads


on 24 BRick .
Attached Image (click to enlarge)
Click to Enlarge

Name: AUDCHFM61 24 pips.png
Size: 20 KB


On 12 Brick . ..
Attached Image (click to enlarge)
Click to Enlarge

Name: AUDCHFM61 12 Pips.png
Size: 19 KB


On 6 Brick . ...... Attachment 3158172

Two downfalls to this trade: 6 Brick chart looks a bit in a range and also the fact the 24 Brick chart has been very bullish and never corrected. However the 12 brick chart has slightly corrected and touched the 12 EMA
I will wait and see.
Attached Image (click to enlarge)
Click to Enlarge

Name: AUDCHFM61 6 pips.png
Size: 18 KB
 
 
  • Post #139
  • Quote
  • Jan 9, 2019 9:36am Jan 9, 2019 9:36am
  •  rcbarlow
  • Joined Sep 2006 | Status: Member | 799 Posts
Great Charts. Hope everyone returns to this strategy and starts posting.
 
1
  • Post #140
  • Quote
  • Edited 7:00am Jan 10, 2019 6:47am | Edited 7:00am
  •  mtharwat
  • Joined Aug 2015 | Status: Member | 978 Posts
Quoting rcbarlow
Disliked
Great Charts. Hope everyone returns to this strategy and starts posting.
Ignored
I hope so rcbarlow.

Have a look pls with me on NZDUSD (Time Charts)

Attached Image (click to enlarge)
Click to Enlarge

Name: NZDUSDWeekly.png
Size: 22 KB


On weekly above, it seems price was making a 123 to the bearish side. However, price almost touched previous support and bounced shraply and the most recent candle (forming) suggesting a possible bullish rally for the short term. This will be clearer in lower TFs.


Attached Image (click to enlarge)
Click to Enlarge

Name: NZDUSDDaily.png
Size: 20 KB


On Daily, we had a big 123 also and a recent break of a TL


Attached Image (click to enlarge)
Click to Enlarge

Name: NZDUSDH4.png
Size: 20 KB


On H4/H1, we can see a clear 123 forming.

The most recent PA on Daily/H4 may suggest a small bullish rally. I am thinking of trading H1/H4 with a good PA at the TL.

What do you think?
 
 
  • Commercial Content
  • /
  • The Spartan Trader FX System
  • Reply to Thread
    • 1 56Page 789 16
    • 1 6Page 78 16
0 traders viewing now
  • More
Top of Page
  • Facebook
  • Twitter
About FF
  • Mission
  • Products
  • User Guide
  • Media Kit
  • Blog
  • Contact
FF Products
  • Forums
  • Trades
  • Calendar
  • News
  • Market
  • Brokers
  • Trade Explorer
FF Website
  • Homepage
  • Search
  • Members
  • Report a Bug
Follow FF
  • Facebook
  • Twitter

FF Sister Sites:

  • Metals Mine
  • Energy EXCH
  • Crypto Craft

Forex Factory® is a brand of Fair Economy, Inc.

Terms of Service / ©2023