Since many ppl are waiting for a correction on cable for the next week and since i'm not a master in correction times, instead of just waiting for the problems to come, i took some time to look at one of the prettiest corrections i've ever seen.
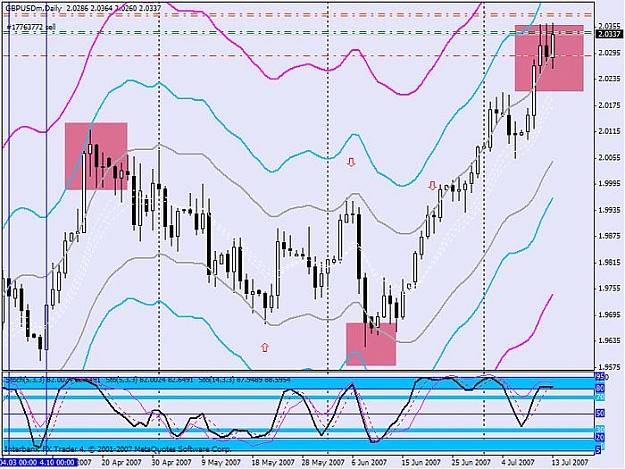
The April 18th to June 8th correction. Nasty but pretty.
http://pwp.netcabo.pt/balbi/gbp1.jpg
Below is a legend of my interpretation for those points and then i will make a conclusion.
I'm sorry because the writing is very far from the picture and you might have dificulty to follow the point by point interpretation considering you have to go back to look again.
Well..
1 - At that time no one really knows that there is a big top there(just like today), whatever everybody might say. Ppl are still in buying mood after that top, but... with a lower target expectation. Calling it a top is pure gambling.
2 - After a series of hourly tops, that last top "2" ends up being a h4 second lower major top. Now everyone is thinking, "Ok thats it, no more up." Correction oficial start.
(We can say "start is at 1" but i am assuming an oficial start when the mood is visibly changed, "lower h4 top")
Also consider a lower or double top with a modest distance from the last one, not 2 or 3 candles later. Thats 1 hour tops seen in a H4 chart, not very good ones. The points are good examples of what we must consider as good tops.
-----------
Before i proceed i must talk about another misconception about tops that i see many times. PPl have a tendency to assume that a double top is in place as soon as they see the price boucing from a previous top a few times or for more time than they expected. However if you look to the past looking for double tops you will not find "bounces". You find follow throughts or tops followed by a considerable fall. The past candles dont show you bounces because candles are static, so a top is a top when you look for it.
For example... look at the points 1 and 2 (and the arrow below 2) and compare with point "10". Can anyone see the diference? "10" is a top and a possible double top not a Real double top Yet.
You might say, "hey but trading is about predicting if it will be or not"
but i say... wrong... trading is about knowing if there is interest of buying or selling at a certain point, so... even if you miss the possible fall after the double top because you waited to see, be happy anyway because now you really know that there is no more buying interest above that levels for a while.
----------
Continuing..
3 - The technical short term bearish status has arrived. Entry orders or long trades targets (from the dips) are now as clear as simple trend line from 1 to 2.
4 - Strong fundamentals are still around and there is a break of the mini trend, but not many buyers around that level because of unclear BoE stance. Price returns to 1 to 2 mini trend, as seen on point "5"
6 - Day before interest rate decision. Price breaks again 1 to 2 trend but tops out at an imaginary parallel trend line starting at "4" but based on the inclination of "1" to "2" trend line. Notice that 1 to 2 trend line and 4 to 6 are exactly parallel. Rate hike decision is dumped.
This might be unknown but it happens all the time on yen pairs, mostly on gbp/jpy, beeing the main trend the base for parallel lines inside that trend.
http://img103.imageshack.us/img103/976/gbp2gf0.jpg
(In this gbp/jpy picture above, "1" to "2" as the main trend, create a perfectly parallel line starting at "3" that rules for long time even after being broken.)
Continuing in the first picture......
7 - BoE talk about possible 0.5 hike in the previous meeting. Another break of 1 to 2 trend line but again 4 to 6 trend take control.
8 - Higher H4 major low, correction oficial end as sentiment is not the same as the days before. Sideways action in place. Not bullish, not bearish.
9 - Another hike being priced. Higher high, All major downtrends breaked. No confirmation on hike. Selloff overreaction. Pure market shock unpricing a "fake" (my holy grail trades ), but not a real bearish move.
Hulk strenght fundamentals continue (hawkish BoE) after sideways price . Daily trend resumes.
A- Market in correction. Reason... pricing in possible future bad news thanks to a big valued currency.
B- No GB bad news. No US good news. Bearish status looses steam as predictions are not confirmed.
C- GB good news are unavoidable(hawkish Boe) . Up trend back. But the most important part i'm beggining to realize is that we can predict if the price will rise above that big top after correction, based on where it was supposed to be if a technical correction never started, considering the funds at that time.
What i mean is that the market will not think like "hey correction is over lets do it right and price again the good news starting from now." No.. what im realizing is that after a correction the market think.. "hey we were wrong lets price the good news we didnt care when we were bearish."
Do you understand what im saying? Because if they really forget the unpriced past news, funds would not be rulling the long term as we know.
Conclusion. What have i learned about correction periods based on this last one?
First. We know that is a correction and not a begin of a major trend, when we see the price rebounding back to near levels almost every day (despite being lower), as show on almost every point. A good comparison is to look at A and C. It might be not important but trading is about confidence too and that kind of certainty about the trend characteristics can help.
Now i know exactly what to do, and thats important. That everyday rebounding action combined with fundamental knowledge can tell us in no time that we are not in a multi year trend reversal or currency holocaust.
So when the price starts to correct, please dont try to say that you have a 1000pip target based on a down trend that is almost in the same range everyday. If we see something like C ok... but A... common...
Another thing is that it's not worth to fight against a correction. As soon as that major double or lower top on 4 hour chart top apear and gets followed by a big drop (important)... Thats it, we have to wait for resume.
In a daily trend no top can happen without confirmation so, its almost impossible to start a new trend before testing 2 times the same or near price.
Thats why ppl have to understand that calling a top based on a big value is not good trading. If anyone have a doubt about price going any higher its simple. Dont trade. Even if we short a top with a good stop. We have to face the last round of buyers that will make our target be very narrow despite of us beeing parcialy right.
Final thing. When in a correction like that, being a bear might be good, but its possible to be a bull and win consistently. What was my mistake in this last correction ? Bad targets. I didnt realized about that lines and despite i was winning i ended up losing or break even as price bounced on that lines. I was away from home to make it right. I stopped trading until i understood better what was going on.
I'm sorry to say this, but im very happy that im not stupid. When i dont understand, i wait. Thats why im a new trader and im still with my first a well alive account. I do not jump into the cliff.
So... all in three points.
What are correction trades all about?
First. Find the trend line that will be rulling the entire thing, directly or indirectly based on her decline. As i shown, this main correction trend can last the entire time being resumed days later even if broken. (this is very important. This one drove me crazy lol. I was long and again the crazy line wasn't dead yet. But now i will check it for good )
)
Second. Correction days might be hard to trade. But remember you can go short and then long right after, and win 100 pips in both trades. Its not bad to be a buyer but only with 2 rules. Do not enter on trades with more than 15 pips distance from the lower channel. Lower your targets to at least 20 pips away from the upper channel.
Third. Remember that if you are a buyer you cannot assume that you are going against the probability, because the same probability says to you that the next move might be the final correction move. So its almost even probability like sideways risk. As i said... Conservative Targets well bellow the confirmed and well spoted lines, are the Key.
Any comments? It's not a complete analysis but, am i right, am i wrong? What do you think?
The April 18th to June 8th correction. Nasty but pretty.
http://pwp.netcabo.pt/balbi/gbp1.jpg
Below is a legend of my interpretation for those points and then i will make a conclusion.
I'm sorry because the writing is very far from the picture and you might have dificulty to follow the point by point interpretation considering you have to go back to look again.
Well..
1 - At that time no one really knows that there is a big top there(just like today), whatever everybody might say. Ppl are still in buying mood after that top, but... with a lower target expectation. Calling it a top is pure gambling.
2 - After a series of hourly tops, that last top "2" ends up being a h4 second lower major top. Now everyone is thinking, "Ok thats it, no more up." Correction oficial start.
(We can say "start is at 1" but i am assuming an oficial start when the mood is visibly changed, "lower h4 top")
Also consider a lower or double top with a modest distance from the last one, not 2 or 3 candles later. Thats 1 hour tops seen in a H4 chart, not very good ones. The points are good examples of what we must consider as good tops.
-----------
Before i proceed i must talk about another misconception about tops that i see many times. PPl have a tendency to assume that a double top is in place as soon as they see the price boucing from a previous top a few times or for more time than they expected. However if you look to the past looking for double tops you will not find "bounces". You find follow throughts or tops followed by a considerable fall. The past candles dont show you bounces because candles are static, so a top is a top when you look for it.
For example... look at the points 1 and 2 (and the arrow below 2) and compare with point "10". Can anyone see the diference? "10" is a top and a possible double top not a Real double top Yet.
You might say, "hey but trading is about predicting if it will be or not"
but i say... wrong... trading is about knowing if there is interest of buying or selling at a certain point, so... even if you miss the possible fall after the double top because you waited to see, be happy anyway because now you really know that there is no more buying interest above that levels for a while.
----------
Continuing..
3 - The technical short term bearish status has arrived. Entry orders or long trades targets (from the dips) are now as clear as simple trend line from 1 to 2.
4 - Strong fundamentals are still around and there is a break of the mini trend, but not many buyers around that level because of unclear BoE stance. Price returns to 1 to 2 mini trend, as seen on point "5"
6 - Day before interest rate decision. Price breaks again 1 to 2 trend but tops out at an imaginary parallel trend line starting at "4" but based on the inclination of "1" to "2" trend line. Notice that 1 to 2 trend line and 4 to 6 are exactly parallel. Rate hike decision is dumped.
This might be unknown but it happens all the time on yen pairs, mostly on gbp/jpy, beeing the main trend the base for parallel lines inside that trend.
http://img103.imageshack.us/img103/976/gbp2gf0.jpg
(In this gbp/jpy picture above, "1" to "2" as the main trend, create a perfectly parallel line starting at "3" that rules for long time even after being broken.)
Continuing in the first picture......
7 - BoE talk about possible 0.5 hike in the previous meeting. Another break of 1 to 2 trend line but again 4 to 6 trend take control.
8 - Higher H4 major low, correction oficial end as sentiment is not the same as the days before. Sideways action in place. Not bullish, not bearish.
9 - Another hike being priced. Higher high, All major downtrends breaked. No confirmation on hike. Selloff overreaction. Pure market shock unpricing a "fake" (my holy grail trades
Hulk strenght fundamentals continue (hawkish BoE) after sideways price . Daily trend resumes.
A- Market in correction. Reason... pricing in possible future bad news thanks to a big valued currency.
B- No GB bad news. No US good news. Bearish status looses steam as predictions are not confirmed.
C- GB good news are unavoidable(hawkish Boe) . Up trend back. But the most important part i'm beggining to realize is that we can predict if the price will rise above that big top after correction, based on where it was supposed to be if a technical correction never started, considering the funds at that time.
What i mean is that the market will not think like "hey correction is over lets do it right and price again the good news starting from now." No.. what im realizing is that after a correction the market think.. "hey we were wrong lets price the good news we didnt care when we were bearish."
Do you understand what im saying? Because if they really forget the unpriced past news, funds would not be rulling the long term as we know.
Conclusion. What have i learned about correction periods based on this last one?
First. We know that is a correction and not a begin of a major trend, when we see the price rebounding back to near levels almost every day (despite being lower), as show on almost every point. A good comparison is to look at A and C. It might be not important but trading is about confidence too and that kind of certainty about the trend characteristics can help.
Now i know exactly what to do, and thats important. That everyday rebounding action combined with fundamental knowledge can tell us in no time that we are not in a multi year trend reversal or currency holocaust.
So when the price starts to correct, please dont try to say that you have a 1000pip target based on a down trend that is almost in the same range everyday. If we see something like C ok... but A... common...
Another thing is that it's not worth to fight against a correction. As soon as that major double or lower top on 4 hour chart top apear and gets followed by a big drop (important)... Thats it, we have to wait for resume.
In a daily trend no top can happen without confirmation so, its almost impossible to start a new trend before testing 2 times the same or near price.
Thats why ppl have to understand that calling a top based on a big value is not good trading. If anyone have a doubt about price going any higher its simple. Dont trade. Even if we short a top with a good stop. We have to face the last round of buyers that will make our target be very narrow despite of us beeing parcialy right.
Final thing. When in a correction like that, being a bear might be good, but its possible to be a bull and win consistently. What was my mistake in this last correction ? Bad targets. I didnt realized about that lines and despite i was winning i ended up losing or break even as price bounced on that lines. I was away from home to make it right. I stopped trading until i understood better what was going on.
I'm sorry to say this, but im very happy that im not stupid. When i dont understand, i wait. Thats why im a new trader and im still with my first a well alive account. I do not jump into the cliff.
So... all in three points.
What are correction trades all about?
First. Find the trend line that will be rulling the entire thing, directly or indirectly based on her decline. As i shown, this main correction trend can last the entire time being resumed days later even if broken. (this is very important. This one drove me crazy lol. I was long and again the crazy line wasn't dead yet. But now i will check it for good
Second. Correction days might be hard to trade. But remember you can go short and then long right after, and win 100 pips in both trades. Its not bad to be a buyer but only with 2 rules. Do not enter on trades with more than 15 pips distance from the lower channel. Lower your targets to at least 20 pips away from the upper channel.
Third. Remember that if you are a buyer you cannot assume that you are going against the probability, because the same probability says to you that the next move might be the final correction move. So its almost even probability like sideways risk. As i said... Conservative Targets well bellow the confirmed and well spoted lines, are the Key.
Any comments? It's not a complete analysis but, am i right, am i wrong? What do you think?