• Home
  • Forums
  • Trades
  • News
  • Calendar
  • Market
  • Brokers
  • Login
  • Join
  • User/Email: Password:
  • 8:53pm
Menu
  • Forums
  • Trades
  • News
  • Calendar
  • Market
  • Brokers
  • Login
  • Join
  • 8:53pm
Sister Sites
  • Metals Mine
  • Energy EXCH
  • Crypto Craft

Options

Bookmark Thread

First Page First Unread Last Page Last Post

Print Thread

Similar Threads

Moutek made me go wrong or i have made mistake in analysis? 8 replies

Trading made possible with EsikeA+++ 905 replies

bo7a method... method for GBP/JPY 205 replies

I'm tired of reading "I'd have made more but I made mistakes." 16 replies

my trading system or trading method 10 replies

  • Trading Journals
  • /
  • Reply to Thread
  • Subscribe
  • 6
Attachments: A possible trading method to be made?
Exit Attachments
Tags: A possible trading method to be made?
Cancel

A possible trading method to be made?

  • Last Post
  •  
  • Page 1 2
  • Page 1 2
  •  
  • Post #1
  • Quote
  • First Post: Apr 14, 2012 9:05am Apr 14, 2012 9:05am
  •  Rtm
  • Joined Jan 2011 | Status: dump and pump | 4,055 Posts
Just discovered something last week that I thought to try to put into theory on a demo account and I have no real results but wanted to see if anyone has thoughts about it working/ not working before I attempt to put mass amounts of time to test it.
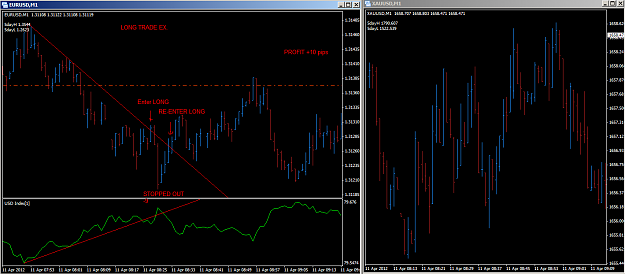
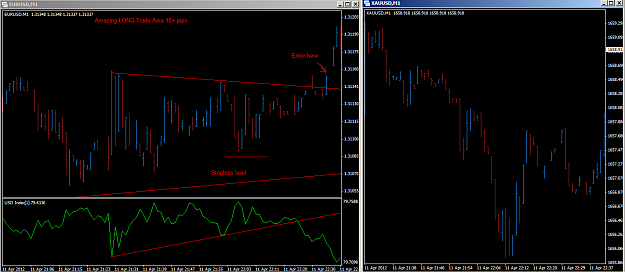
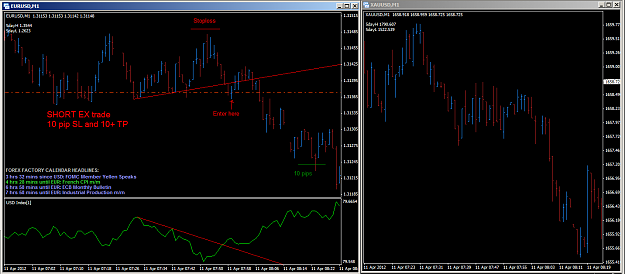
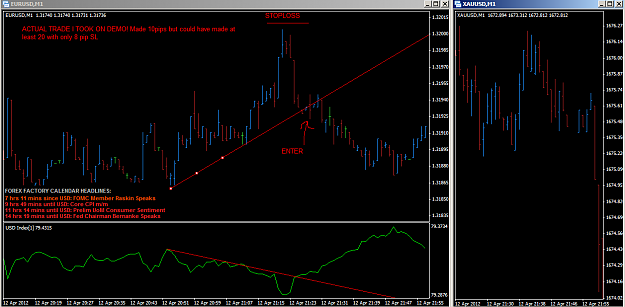
So I was trading this on the EUR/USD 1 min chart however I think any time frame or pair could work but for this purpose I use these settings. You will only need one indicator which is not even really an indicator but the USD Index in indicator form[see attached]. The rest is all price action using trendlines and waiting for breaches of the lines in a break fashion, ie. the bar MUST close above/below the line. I think the pictures here offer more than trying to describe this in words.
One important rule for this style of trading is that I wanted to have a good R:R for shorter term trading so for now Im starting with 1:1 Risk to Reward but I think this could maybe be pushed up to 1:2 or even 1:3 with a higher time-frame. Sorry I dont have much time to complete this post so I will leave it at this for now, would love to here anyone's thoughts or suggestions to this approach.

Note: I also just had a visual of the Gold chart beside to see if it would cause any correlation.
Attached Image(s) (click to enlarge)
Click to Enlarge

Name: LONG01.PNG
Size: 58 KB
Click to Enlarge

Name: LONG02.PNG
Size: 51 KB
Click to Enlarge

Name: SHORT01.PNG
Size: 56 KB
Click to Enlarge

Name: SHORT02.PNG
Size: 52 KB
Attached File(s)
File Type: mq4 USD Index[1].mq4   2 KB | 271 downloads
File Type: ex4 USD Index[1].ex4   3 KB | 220 downloads
All posts are my personal opinion
  • Post #2
  • Quote
  • Apr 14, 2012 11:41am Apr 14, 2012 11:41am
  •  espen
  • | Joined Mar 2012 | Status: Member | 109 Posts
I'm glad you've found something that works for you, I'll be looking forward to see how it goes.
 
 
  • Post #3
  • Quote
  • Apr 14, 2012 11:54am Apr 14, 2012 11:54am
  •  Winston Reed
  • Joined Mar 2009 | Status: Hobby Trader | 4,477 Posts
Sounds essentially like a breakout system. Breakouts occur less than bounces. With 1:1 RR you are likely to die a death of a 1000 cuts. Perhaps a system of trading with the trend? IMHO.
 
 
  • Post #4
  • Quote
  • Apr 14, 2012 5:56pm Apr 14, 2012 5:56pm
  •  Kelvor
  • | Joined Apr 2012 | Status: Member | 55 Posts
Niceee, is the first time that i see USDIndex as indicator

Well, i don't know, but i think that if you wish to make a correlation between USDi and EURUSD would be better open the USD Index in candlestick (or bars) form.

Using the index as indicator you trace trendlines based only on price closes, while in your chart you make trendlines based in low/high. So it may cause some troubles, don't?
pips pips pips pips....
 
 
  • Post #5
  • Quote
  • Apr 14, 2012 7:09pm Apr 14, 2012 7:09pm
  •  Rtm
  • Joined Jan 2011 | Status: dump and pump | 4,055 Posts
Quoting espen
Disliked
I'm glad you've found something that works for you, I'll be looking forward to see how it goes.
Ignored

Im not sure its there yet, just maybe something that may build into something more. I will be building from this though if I can get at least breakeven or profit from it. Will keep this thread updated until further notice. Thank you for your support!!
All posts are my personal opinion
 
 
  • Post #6
  • Quote
  • Apr 14, 2012 7:11pm Apr 14, 2012 7:11pm
  •  Rtm
  • Joined Jan 2011 | Status: dump and pump | 4,055 Posts
Quoting Winston Reed
Disliked
Sounds essentially like a breakout system. Breakouts occur less than bounces. With 1:1 RR you are likely to die a death of a 1000 cuts. Perhaps a system of trading with the trend? IMHO.
Ignored

I guess your right, it is essentially a reversal-breakout system. Yeah I thought about that but I dont know how I could fit that in with this. What pattern would I have to establish to fit that? Because if I could make this into both perhaps it might be even better?
All posts are my personal opinion
 
 
  • Post #7
  • Quote
  • Apr 14, 2012 8:08pm Apr 14, 2012 8:08pm
  •  Rtm
  • Joined Jan 2011 | Status: dump and pump | 4,055 Posts
Quoting Kelvor
Disliked
Niceee, is the first time that i see USDIndex as indicator

Well, i don't know, but i think that if you wish to make a correlation between USDi and EURUSD would be better open the USD Index in candlestick (or bars) form.

Using the index as indicator you trace trendlines based only on price closes, while in your chart you make trendlines based in low/high. So it may cause some troubles, don't?
Ignored

When I searched for the USD index indicator, this was all I found so I am using the best I got. As for drawing trendlines I use the highs and lows as the support and resistance for the trend and then the part where I say it has to close above or below is more of a break-momentum. if it breaks the line then closes below, to me that shows weakness and is more likely to be a bounce as opposed to a trend breakout. I dont know, what do you think?
All posts are my personal opinion
 
 
  • Post #8
  • Quote
  • Apr 14, 2012 9:17pm Apr 14, 2012 9:17pm
  •  abi2712
  • | Joined Apr 2012 | Status: Member | 69 Posts
A very interesting strategy, the charts look very promising, however could you kindly explain your entry strategy, I can't seem to find the 'trigger' that makes you enter a trade

Cheers
Abi
An investment in knowledge pays the best interest - Ben Franklin
 
 
  • Post #9
  • Quote
  • Apr 14, 2012 9:21pm Apr 14, 2012 9:21pm
  •  Rtm
  • Joined Jan 2011 | Status: dump and pump | 4,055 Posts
Quoting abi2712
Disliked
A very interesting strategy, the charts look very promising, however could you kindly explain your entry strategy, I can't seem to find the 'trigger' that makes you enter a trade

Cheers
Abi
Ignored
Sorry for not making it clear. The trigger is once the trendline on either USD index or both USD index and price is closed broken you enter on the direction of the break. Hope that helps a little bit.
All posts are my personal opinion
 
 
  • Post #10
  • Quote
  • Apr 14, 2012 9:28pm Apr 14, 2012 9:28pm
  •  abi2712
  • | Joined Apr 2012 | Status: Member | 69 Posts
Quoting Rtm
Disliked
Sorry for not making it clear. The trigger is once the trendline on either USD index or both USD index and price is closed broken you enter on the direction of the break. Hope that helps a little bit.
Ignored
Thanks for clarifying that, I haven't had an opportunity to try this system out but I'd like to throw an idea out, The USDi is made out of a basket of other currencies, keeping that in mind can we trade divergence, that is, say the USDi makes a new low, this clearly shows that the USD is performing poorly against its counterparts, but if at the same time the EURUSD doesn't make a new high, well that could be a good opportunity to go long as the USDi is suggesting impending dollar weakness.
An investment in knowledge pays the best interest - Ben Franklin
 
 
  • Post #11
  • Quote
  • Apr 14, 2012 9:42pm Apr 14, 2012 9:42pm
  •  CindyXXXX
  • Joined Feb 2008 | Status: Member | 6,736 Posts
Quoting abi2712
Disliked
Thanks for clarifying that, I haven't had an opportunity to try this system out but I'd like to throw an idea out, The USDi is made out of a basket of other currencies, keeping that in mind can we trade divergence, that is, say the USDi makes a new low, this clearly shows that the USD is performing poorly against its counterparts, but if at the same time the EURUSD doesn't make a new high, well that could be a good opportunity to go long as the USDi is suggesting impending dollar weakness.
Ignored
Wouldn't this actually suggest massive EUR weakness, since EUR makes up 60% of the Dollar index?
Time hides Nothing
 
 
  • Post #12
  • Quote
  • Apr 14, 2012 9:50pm Apr 14, 2012 9:50pm
  •  Rtm
  • Joined Jan 2011 | Status: dump and pump | 4,055 Posts
Quoting abi2712
Disliked
Thanks for clarifying that, I haven't had an opportunity to try this system out but I'd like to throw an idea out, The USDi is made out of a basket of other currencies, keeping that in mind can we trade divergence, that is, say the USDi makes a new low, this clearly shows that the USD is performing poorly against its counterparts, but if at the same time the EURUSD doesn't make a new high, well that could be a good opportunity to go long as the USDi is suggesting impending dollar weakness.
Ignored


Hey now that is really interesting actually! I think that might be another way of doing it also.
All posts are my personal opinion
 
 
  • Post #13
  • Quote
  • Apr 14, 2012 9:59pm Apr 14, 2012 9:59pm
  •  abi2712
  • | Joined Apr 2012 | Status: Member | 69 Posts
Quoting CindyXXXX
Disliked
Wouldn't this actually suggest massive EUR weakness, since EUR makes up 60% of the Dollar index?
Ignored
If the USDi makes a new low, suggesting that the dollar is performing poorly but we do not see a significant up-move in the EURUSD then that shows that the dollar has performed very badly in terms of other currencies (since as you said the EUR makes 60% of the USDi) this would suggest that it would eventually weaken against the EUR as well and hence we should go long on the EURUSD as we might see an up move.

If you look at the second chart that RTM posted you will see what I mean, The USDi made a new low (almost bottoming out) and at the same time the EURUSD did not make a significant up-move, according to me that was divergence, the EURUSD was not obeying the USDi and after that as time progressed we saw an up-move in the EURUSD, again, I have not looked at this strategy in detail so I can't say whether my take on divergence might work or not but I feel it would be a good thing to look into since, as you pointed out, the EUR forms a major part of the USDi
An investment in knowledge pays the best interest - Ben Franklin
 
 
  • Post #14
  • Quote
  • Apr 14, 2012 10:14pm Apr 14, 2012 10:14pm
  •  CindyXXXX
  • Joined Feb 2008 | Status: Member | 6,736 Posts
Quoting abi2712
Disliked
If the USDi makes a new low, suggesting that the dollar is performing poorly but we do not see a significant up-move in the EURUSD then that shows that the dollar has performed very badly in terms of other currencies (since as you said the EUR makes 60% of the USDi) this would suggest that it would eventually weaken against the EUR as well and hence we should go long on the EURUSD as we might see an up move.
Ignored
Why?

(sorry not trying to being difficult I'm a big fan of new ideas, just trying to get my head around your logic)
Time hides Nothing
 
 
  • Post #15
  • Quote
  • Apr 14, 2012 10:22pm Apr 14, 2012 10:22pm
  •  Kelvor
  • | Joined Apr 2012 | Status: Member | 55 Posts
Quoting abi2712
Disliked
Thanks for clarifying that, I haven't had an opportunity to try this system out but I'd like to throw an idea out, The USDi is made out of a basket of other currencies, keeping that in mind can we trade divergence, that is, say the USDi makes a new low, this clearly shows that the USD is performing poorly against its counterparts, but if at the same time the EURUSD doesn't make a new high, well that could be a good opportunity to go long as the USDi is suggesting impending dollar weakness.
Ignored
This perspective is very interesting. In fact the USDi shows some divergences agains EURUSD and another currencies derivated by USD. I think that the better way to analyze it is makin' a average rate, taking a fixed period, and see the (positive divergences)/(negative divergences).

Perhaps would be nice make a rsi(9) divergences ratio in the same time frame and periodicity too to compare them and see the results since the RSI is the most (that i belive) popular indicator used for divergences.


Well, i think that i will do it for curiosity
Someone is applying too?
pips pips pips pips....
 
 
  • Post #16
  • Quote
  • Apr 15, 2012 7:23am Apr 15, 2012 7:23am
  •  abi2712
  • | Joined Apr 2012 | Status: Member | 69 Posts
Quoting CindyXXXX
Disliked
Why?

(sorry not trying to being difficult I'm a big fan of new ideas, just trying to get my head around your logic)
Ignored
I apologize Cindy, my power of expression is a little weak, allow me to try again from the top.

The USDi is made up of a basket of currencies (EUR JPY etc etc) 60% of this comes from the EUR, we are in agreement until there I believe.

Now let us assume that the USDi is performing poorly and makes a new low, now this clearly shows that the dollar is being outperformed by its counterparts, but let us also assume that the EURUSD pair has not had any significant rise. This means that the majority of the USDi's fall resulted from the other 40% (JPY CAD etc etc) not the EUR.

This is where I believe divergence occurs, the EUR has not made any new highs but the USDi has fallen, this shows broad USD weakness against other currencies, my logic is, that if the USD has performed so badly against other currencies and not the EUR, in time it will perform badly against the EUR as well since there has to be an underlying fundamental reason as to why that occurred. I think if we analyze the charts more carefully using the USDi index and try to look for these patterns we will see whether this opinion is only good on paper or can be used to make some pips as well.

Hope this helps
Abi
An investment in knowledge pays the best interest - Ben Franklin
 
 
  • Post #17
  • Quote
  • Apr 15, 2012 7:26am Apr 15, 2012 7:26am
  •  abi2712
  • | Joined Apr 2012 | Status: Member | 69 Posts
Quoting Kelvor
Disliked
This perspective is very interesting. In fact the USDi shows some divergences agains EURUSD and another currencies derivated by USD. I think that the better way to analyze it is makin' a average rate, taking a fixed period, and see the (positive divergences)/(negative divergences).

Perhaps would be nice make a rsi(9) divergences ratio in the same time frame and periodicity too to compare them and see the results since the RSI is the most (that i belive) popular indicator used for divergences.


Well, i think that i will do it for curiosity...
Ignored
Kelvor thats an interesting idea, I think it would clearly show whether the USDi divergence provides any real trading opportunities, what time frame do you propose?
An investment in knowledge pays the best interest - Ben Franklin
 
 
  • Post #18
  • Quote
  • Apr 15, 2012 1:27pm Apr 15, 2012 1:27pm
  •  Kelvor
  • | Joined Apr 2012 | Status: Member | 55 Posts
Quoting abi2712
Disliked
Kelvor thats an interesting idea, I think it would clearly show whether the USDi divergence provides any real trading opportunities, what time frame do you propose?
Ignored
What do you think about M5? I will start with monday of this last week (9 april) because this week we had a good scenario on EURUSD (We had period of consolidation and period with trend). I want to see how USDi divergence works on both scenarios.

I should started yesterday, but i couldn't because i had to format my computer
I will try to post some results of this comparation today
pips pips pips pips....
 
 
  • Post #19
  • Quote
  • Apr 15, 2012 2:37pm Apr 15, 2012 2:37pm
  •  abi2712
  • | Joined Apr 2012 | Status: Member | 69 Posts
Quoting Kelvor
Disliked
What do you think about M5? I will start with monday of this last week (9 april) because this week we had a good scenario on EURUSD (We had period of consolidation and period with trend). I want to see how USDi divergence works on both scenarios.

I should started yesterday, but i couldn't because i had to format my computer
I will try to post some results of this comparation today
Ignored
I think M5 would definitely provide good scalping opportunities, however, that said, backtesting might require a longer time frame so as to give the system more credibility, I will try and look at the H1 and Daily charts and see whether the system works.

Also, have you heard of the FXCM USDi, it is very similar to the index that is used here but it, in my opinion, provides a slightly more detailed look at the USD's performance http://www.fxcm.co.uk/usdollar-dow-j...irect=fxcm.com

I have been using this particular index to gauge risk appetite with good results.

Cheers
Abi
An investment in knowledge pays the best interest - Ben Franklin
 
 
  • Post #20
  • Quote
  • Apr 15, 2012 9:20pm Apr 15, 2012 9:20pm
  •  Kelvor
  • | Joined Apr 2012 | Status: Member | 55 Posts
Quoting abi2712
Disliked
I think M5 would definitely provide good scalping opportunities, however, that said, backtesting might require a longer time frame so as to give the system more credibility, I will try and look at the H1 and Daily charts and see whether the system works.

Also, have you heard of the FXCM USDi, it is very similar to the index that is used here but it, in my opinion, provides a slightly more detailed look at the USD's performance http://www.fxcm.co.uk/usdollar-dow-j...irect=fxcm.com

I have been using...
Ignored
Yep, i think you're right, but i think M5 would be fine for comparation because is possible analyze more divergences in a week than H1 time frame, for example. After all the market follows the fractal methodology, i think that the estatistic in M5 would be behave in H1 too. Well, all of this is motivation for research

But you said about the FXCM USDi. I open your link and read about it and i saw that this index is based on EURUSD, GBPUSD, AUDUSD and USDJPY.
I don't know, but probably they use the geometrical average for calcutate the value of the index. But the matter is that the true USDi is, by definition, calculated by geometrical average using the currencies EUR/USD, USD/JPY, GBP/USD, USD/CAD, USD/SEK and USD/CHF (using the respectives weights: -0.576, 0.136, -0.119, 0.091, 0.042 and 0.036).

Now, comparating USDi with the FXCM USDi we would gain information with one currency (AUDUSD), but we would lose information about 3 currencies (USDCAD, USDSEK and USDCHF).

I don't know if it would be better or worse, but definitely they are different charts as different 'indicators'. It means to the best way to know is making a rate with FXCM USDi too..
pips pips pips pips....
 
 
  • Trading Journals
  • /
  • A possible trading method to be made?
  • Reply to Thread
    • Page 1 2
    • Page 1 2
0 traders viewing now
  • More
Top of Page
  • Facebook
  • Twitter
About FF
  • Mission
  • Products
  • User Guide
  • Media Kit
  • Blog
  • Contact
FF Products
  • Forums
  • Trades
  • Calendar
  • News
  • Market
  • Brokers
  • Trade Explorer
FF Website
  • Homepage
  • Search
  • Members
  • Report a Bug
Follow FF
  • Facebook
  • Twitter

FF Sister Sites:

  • Metals Mine
  • Energy EXCH
  • Crypto Craft

Forex Factory® is a brand of Fair Economy, Inc.

Terms of Service / ©2023