***** Latest update here: http://www.forexfactory.com/showthre...88#post5596788 *****
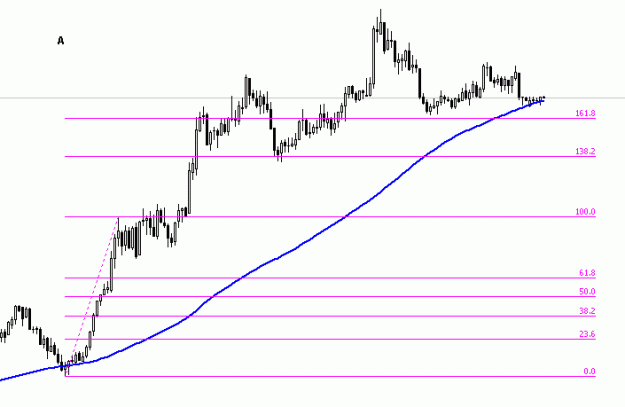
I only started this thread a few weeks ago but already it has evolved into something better. The basic idea is the same, we're going to use fibonacci retracements to enable us to buy/sell into the trend when the momentum is moving back in the direction of the trend. We're also going to use the 38.2% fibonacci extension as a profit target.
When I started the thread I had the idea of using a 100 sma to define the trend and then only take trades in that direction but I found that this is too restrictive and a lot of profitable trades were being missed as a result. Now I am using the zig zag indicator which comes with mt4. I am yet to find a setting that suits all pairs in all timeframes but using 15 as the first setting seems to cover most eventualities. This indicator isn't to be used rigidly, it is merely there to help spot the best swing high/low points to use for drawing fib retracements.
I am using this on all pairs and all timeframes and I prefer to find a strong trend although I am willing to take trades that don't necessarily fit the criteria if I see a trend change in progress or a smooth trendline forming. I have found trendlines to be a good tool to help spot good trades for this method.
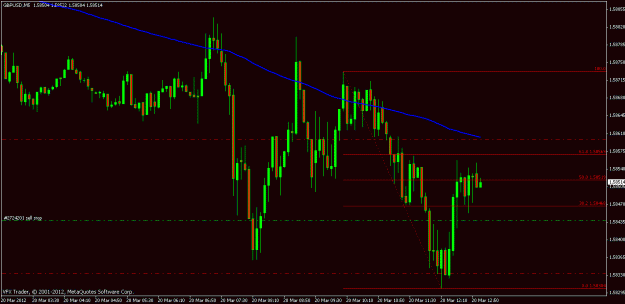
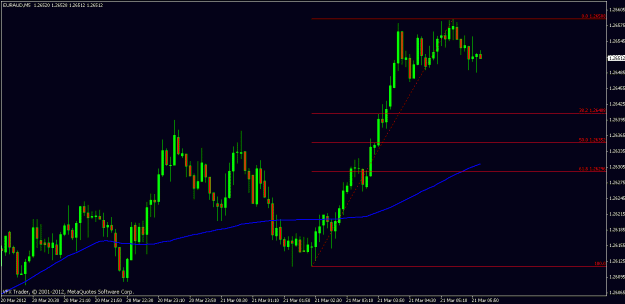
The basic system involves first spotting an impulse wave in a trend. If you don't know how to do this then there are charts below or you just need to do some more reading! Then you draw a fibonacci retracement on the chart (again, if you don't know how you need to read more). Once the price retraces to the 50% fib retracement level then you place a pending order the other side of the 38.2% level. In an uptrend you would put a buy order 1 pip plus the spread above the 38.2% level. In a downtrend do the opposite. The first profit target is the last swing high/low point plus or minus 1 pip and the spread depending on the direction. I take profit on half the position at that point. The profit target for the remaining trade is 1 pip plus spread above/below the 38.2% fib extension. The stop loss goes 1 pip plus spread the other side of the 61.8% retracement level.
If all that sounds too complicated then we have a tool to help. FerruFX who is an awesome coder has kindly put together an EA which does all the work for you. Just place the fibs on the chart and rename it BUY or SELL depending on which direction you want it to trade. If the retracement pulls back to the 50% level then it will automatically place the pending order, stop loss and take profit. If the price then continues beyond the 75% level it will remove all orders as the setup is invalidated. If the trade is entered the ea takes half profit at the first target level and trails the stop on the second half of the trade. Most of these figures are adjustable in the ea so if you want to take 66% profit at the first level you can or if you want to invalidate the trade at 61.8% instead of 75% you can. I have attached the latest version below but it may well be updated as we go along so check the latest version.
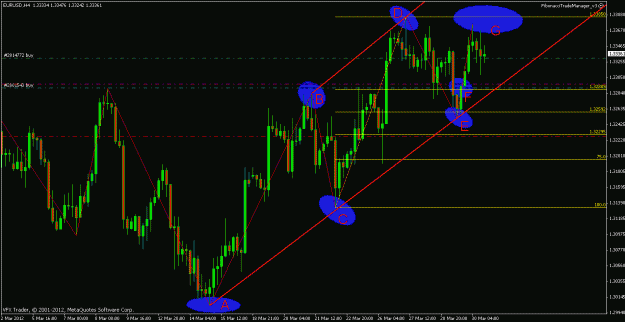
There are some screenshots attached below as well which illustrate what I am looking for when I take a trade. The first one is eurusd...
Point A is the low point of the current trend. Point B is the first swing high. Point C is the first retracement point, a higher low. Point D is the next swing high point. By point D you can see a possible channel forming and you can have the channel lines drawn. At point E I've already got my fibs drawn and the trade is validated by the price touching and just breaching the 50% fib level. It is extra confirmation that the touch of the 50% fib level happens more or less in conjunction with the rising lower trendline. At point F the trade is entered by the pending order as the price moves through. Now waiting for the first profit target to be met at point G.
The second chart is the same eurusd chart zoomed out a little. Point H is the ultimate profit target. Notice how it corresponds with the major resistance level just before 1.35. You can see by zooming out the chart that the trade has room to move, there are no major support and resistance levels in the way to stop it and it is a large enough trade to give good risk/reward.
The third chart is audusd, again another nice channel but this time to the downside. I had a short trade on the last swing down which reached the first take profit level but then reversed. I took profit on the second trade because I had bought eurusd and didn't want to be long one and short the other. Looks as though we could be setting up for another short.
To sum up, these trades happen all the time on all timeframes where the price pushes in one direction and then retraces before carrying on in the main direction. The advantage to using fibonacci in this way is that you are only taking the trade once the price has reached at least 50% retracement and then started to move back in the direction of the trend. It is an almost completely mechanical system once you have identified the swing, the only hard part about it is determining the best swings to watch for a retrace. I will be posting my trades before they setup as we go along so if you're unsure about any of the above read the rest of the thread and you should find the answer. If you still need help then just ask.
Attached File(s)


