Ok, let's think this through. I used to do a lot of eod trading (end of day) and back then I would look at monthly and weekly charts and be able to build a picture of where the nearest s/r levels were, what the overall trend was and where I expected the price to go IF those levels held and IF that trend continued. So I've been thinking and thinking about how we can improve this system so that we're not just finding a swing, drawing a fib study and hoping it will work out. If you have seen any of my other systems you will know that I like using stochastics to gauge the strength of pullbacks and to give me information about the current direction of the momentum. I have been using them for quite a long time now and I am fully aware of their limitations. I strongly believe that with a bit of work done on a weekend we can build a picture of what will POSSIBLY happen over the coming week and that this will give us the extra edge we need to take this from a good but unpolished system to a truly awesome system.
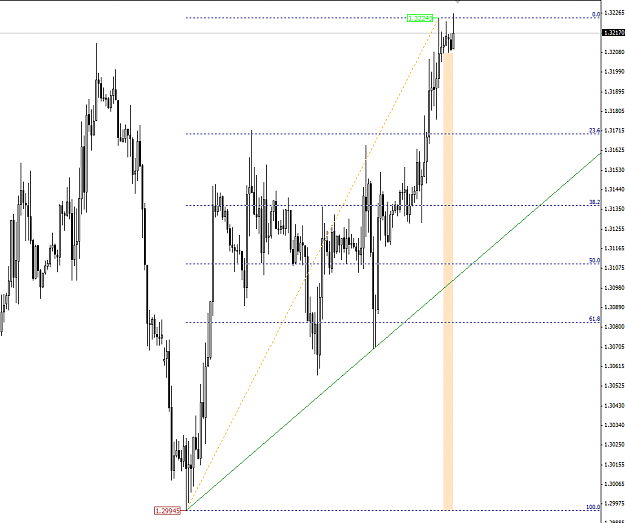
Here's my analysis of eurusd for next week. The weekly stochs are pointing down and the general trend is down although 1.30 is providing strong support and last week gave us a large bullish candle. Given the climate in the euro zone and the general stability (or perceived stability) in the US economy I can see no reason to be bullish this pair at this time. It is for this reason that I would expect that downwards trendline and the upcoming round numbers of either 1.3250 or 1.3300 to act as resistance and the downwards move will resume. If this does actually transpire and the price moves downwards I will trade it accordingly on the 4 hour chart expecting a nice couple of tradeable swings down to 1.30 and possibly below. If the price breaks those resistance levels and that trendline I would look for a pullback to the top of the trendline and would trade it long. If the price stays in a range and shows no valid swings in one direction or the other then I will not trade this pair next week.
I will complete similar analyses for every other pair with trendlines, stochs and horizontal s/r and then just trade the plan accordingly.
Does anyone have any comments on this approach?
Also I am going to take profit at the 0.0% level, the last swing high/low. I believe the risk reward ratio combined with the probability of the trade hitting that level will still provide a profitable system. Also I am considering moving to break even once the trade has reached the 20% level which will be roughly halfway between 38.2 where we entered the trade and 0.0. FerruFX, thank you kindly for your work on the ea so far but I wonder if you could incorporate these new rules into a seperate version for testing? So the parameters are roughly the same, retrace to 50%, place the trade at 38.2, take full profit at 0.0 and optional move to break even at 20%? I would be grateful if you could incorporate this change? Thanks.
As the week progresses and I get evidence that my analysis is correct in either direction then I will be looking for trendlines and channels that I can use to inform my trades even more.
Thanks to everyone who has followed this thread so far, voted for it and contributed their time and effort to make this thread what it is. I hope we can all continue to work together to really push this system to the highest level of achievement.
Attached Image(s) (click to enlarge)