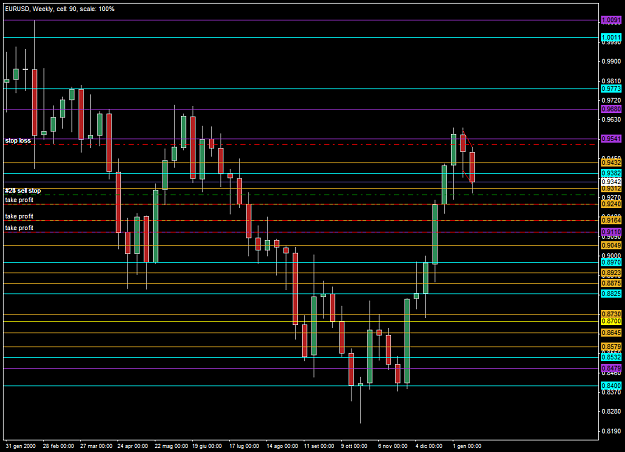
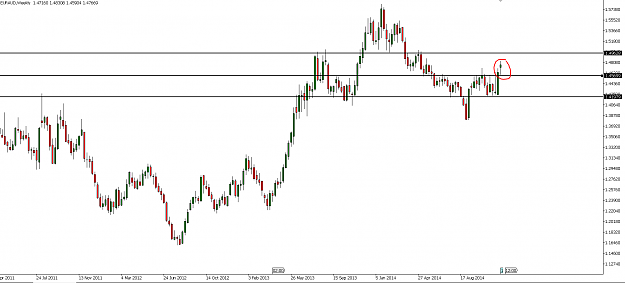
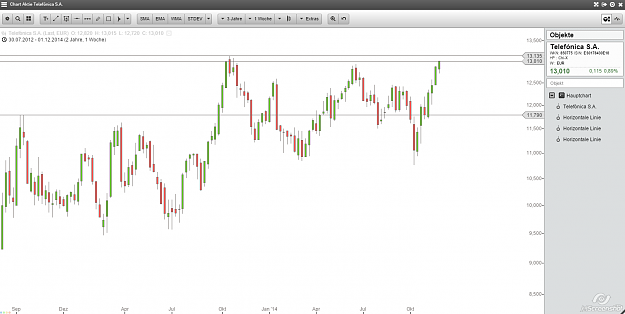
Telefonica S.A. now at top of RM ( weekly chart ).....
Watching for breakout and confirmation, or back into RM. The chart looks quite bullish so far....
Good trading to all !
M.
Watching for breakout and confirmation, or back into RM. The chart looks quite bullish so far....
Good trading to all !
M.
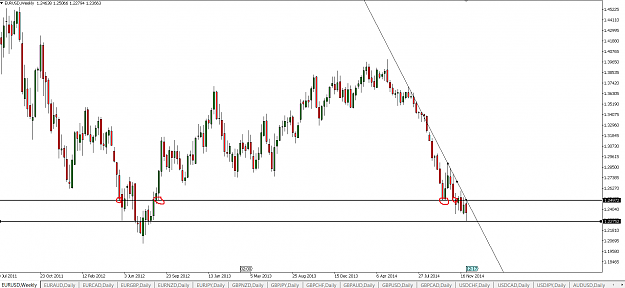
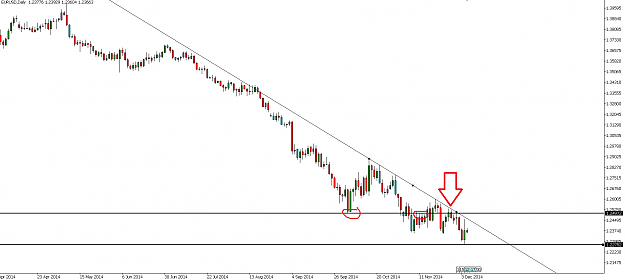
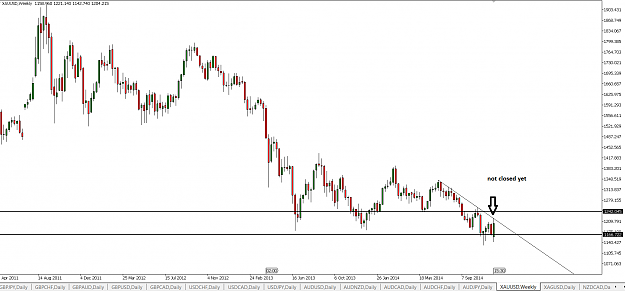
Attached Image (click to enlarge)
Be like water.