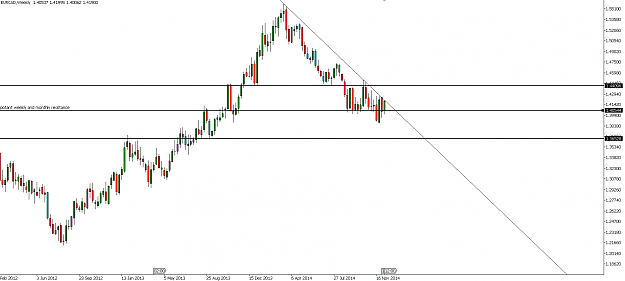
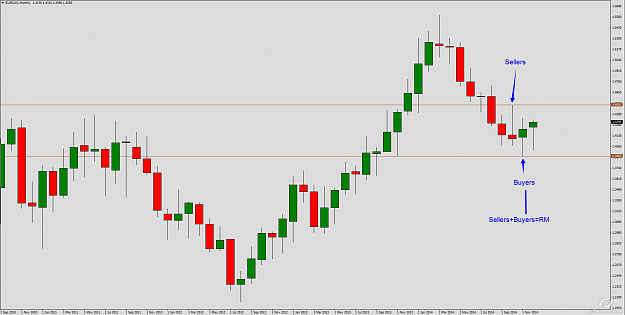
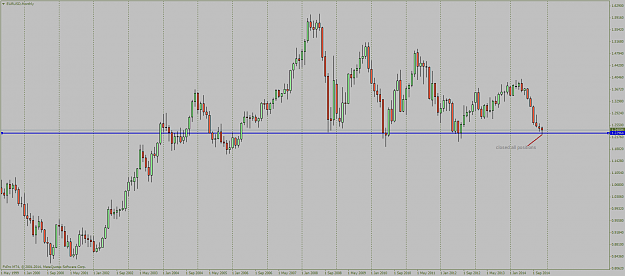
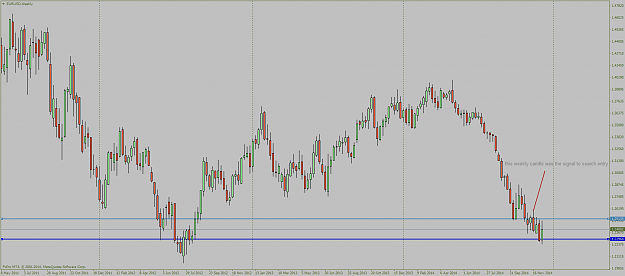
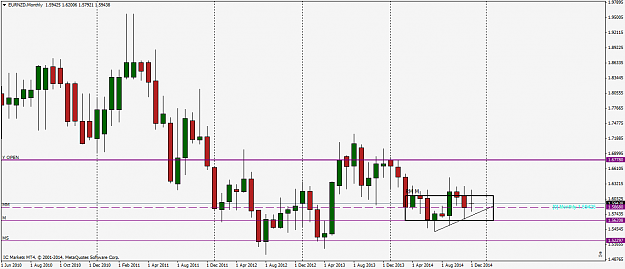
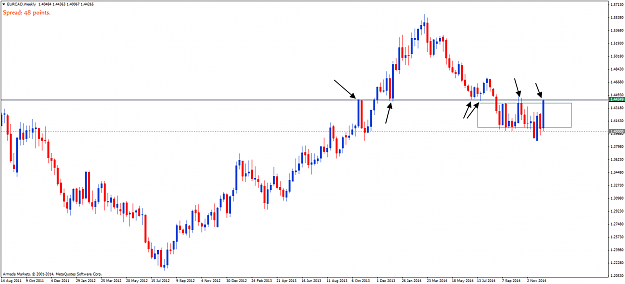
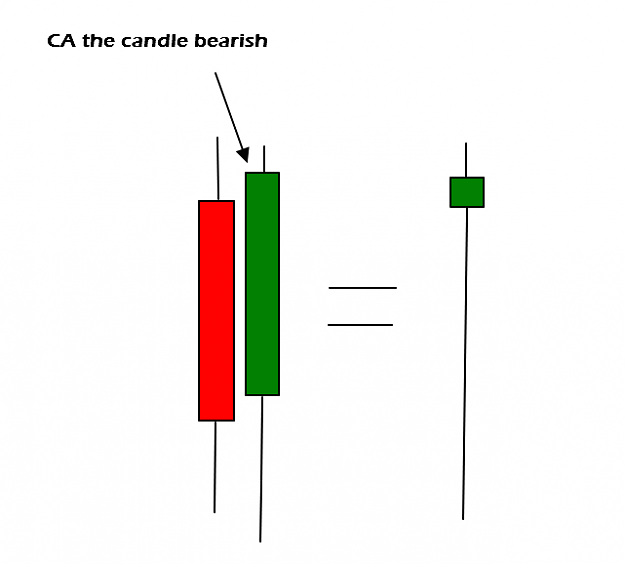
• Home
  • Forums
  • Trades
  • News
  • Calendar
  • Market
  • Brokers
  • Login
  • Join
  • User/Email: Password:
  • 5:21am
Menu
  • Forums
  • Trades
  • News
  • Calendar
  • Market
  • Brokers
  • Login
  • Join
  • 5:21am
Sister Sites
  • Metals Mine
  • Energy EXCH
  • Crypto Craft

Options

Bookmark Thread

First Page First Unread Last Page Last Post

Print Thread

Similar Threads

M candles / Custom candles for second charts 1 reply

Calculating only buy candles vs sell candles 2 replies

Platform which enables the rewinding of candles 3 replies

Missing candles? 1 reply

I need more candles! 4 replies

  • Commercial Content
  • /
  • Reply to Thread
  • Subscribe
  • 2,054
Attachments: Beyond the Candles
Exit Attachments
Tags: Beyond the Candles
Cancel

Beyond the Candles

  • Last Post
  •  
  • 1 105106Page 107108109 126
  • 1 Page 107 126
  •  
  • Post #2,121
  • Quote
  • Dec 7, 2014 1:03pm Dec 7, 2014 1:03pm
  •  Thenew
  • | Joined Dec 2007 | Status: Member | 184 Posts
Quoting Ttf
Disliked
Hey, I have a question about the PB on EURAUD weekly (see chart). How do I know if it is bullish information (rejection of new support) or bearish information (inverted PB showing selling pressure) which might indicate price turning back into the range? Thanks in advance {image}
Ignored

Hi Tft...

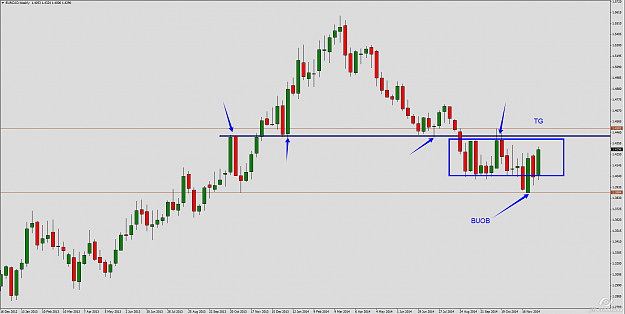
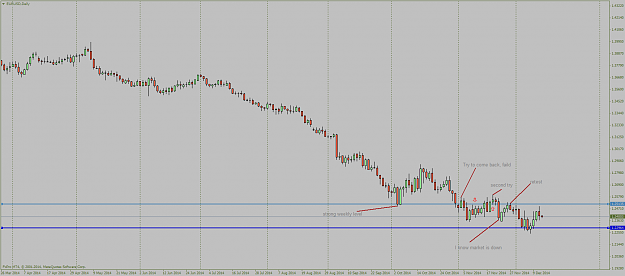
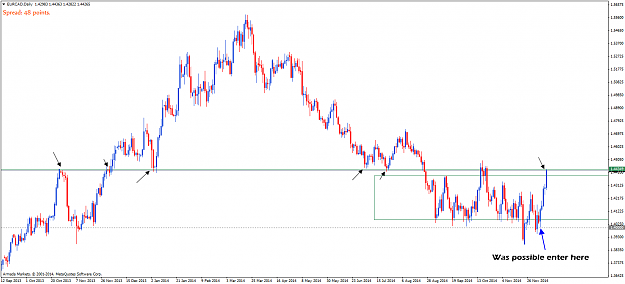
Fxgroup talked about this pair in the webinar, so if you were long already from previous support at 1,4590ish
i think the best approach is to protect your capital, taking some action, i always do that when i see price acting
in a way that i dont like, either pulling some profits, moving stops to be or simply taking full profits there, this is
a personnal matter everyone, should find is way to manage is own book.
I guess screen time will be our best teacher for this i suppose.

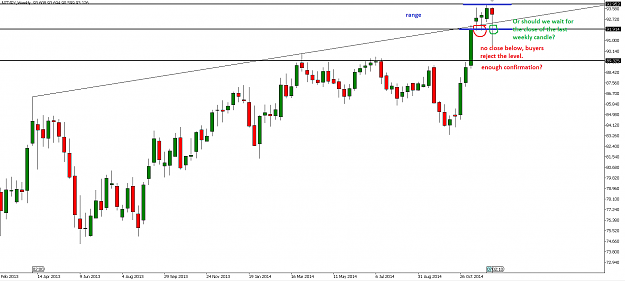
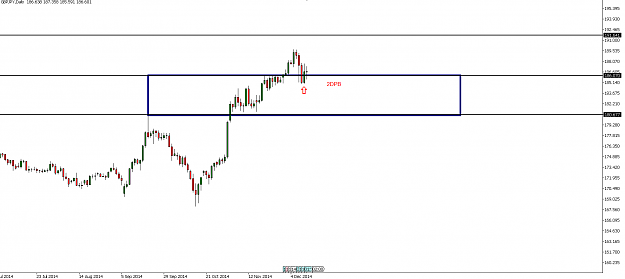
My view about the pair is that it should reach at least 1,4906 resistance, the weekly bar you refered showed some profit taking
already but it managed to stay above 1,4745 s/r, so this can lead us to have positive expectation about future price movement...
thatīs my 2 cents
 
 
  • Post #2,122
  • Quote
  • Dec 8, 2014 6:34pm Dec 8, 2014 6:34pm
  •  fxgroup
  • | Commercial Member | Joined Nov 2010 | 1,178 Posts
EURAUD

The Settember's BUOB gave us the RM's confirmation with the DB. Now the P is heading to 1.50 as the most important MM level within the RM.
If the P will close above it, then the 1.55 will become the second TG and the final one inside the RM !
Attached Image (click to enlarge)
Click to Enlarge

Name: EURAUD.png
Size: 54 KB
Nothing personal,just business
 
 
  • Post #2,123
  • Quote
  • Dec 10, 2014 4:36am Dec 10, 2014 4:36am
  •  Ttf
  • | Joined Nov 2014 | Status: Member | 50 Posts
At the moment, EURCAD and NZDCAD are interesting for me.
EURCAD:
I would appreciate it if someone could say something about the monthly chart
On the weekly price is in a downtrend following a bearish trendline and sitting on a important support right now
On the daily there's a PB and I'm asking myself if I should take it or wait for a break of the Trendlines?
NZDCAD:
On monthly chart there was uptrend then pullback and now price is at important support.
On weekly chart price is either in range and a triangle. Are both possible?
On the daily price is at support of triangle and now going to the resistance. A PB formed. I think it was a good signal but somehow I missed it. Can we still enter?

Best regards!
Attached Image(s) (click to enlarge)
Click to Enlarge

Name: eurcad weekly.PNG
Size: 43 KB
Click to Enlarge

Name: eur cad daily.PNG
Size: 54 KB
Click to Enlarge

Name: nzd cad weekly.PNG
Size: 24 KB
Click to Enlarge

Name: nzdcad daily.PNG
Size: 26 KB
 
 
  • Post #2,124
  • Quote
  • Dec 10, 2014 4:05pm Dec 10, 2014 4:05pm
  •  Beertje
  • | Joined Oct 2011 | Status: Member | 446 Posts
Quoting Ttf
Disliked
At the moment, EURCAD and NZDCAD are interesting for me. EURCAD: I would appreciate it if someone could say something about the monthly chart On the weekly price is in a downtrend following a bearish trendline and sitting on a important support right now On the daily there's a PB and I'm asking myself if I should take it or wait for a break of the Trendlines? NZDCAD: On monthly chart there was uptrend then pullback and now price is at important support. On weekly chart price is either in range and a triangle. Are both possible? On the daily price...
Ignored
NZDCAD
Do not subtract the wrong conclusions from what happened today. Yes nzdcad W is Rm, and there is a triangle in this range. Today was the nzd interest rate decision, and have made the move. Wait until the price make a break out upwards or downwards and look for retest. Always look the economic calendar!
 
 
  • Post #2,125
  • Quote
  • Dec 10, 2014 4:08pm Dec 10, 2014 4:08pm
  •  Beertje
  • | Joined Oct 2011 | Status: Member | 446 Posts
And of course, no entry some before an important data, like interest rate...
 
 
  • Post #2,126
  • Quote
  • Dec 11, 2014 6:05am Dec 11, 2014 6:05am
  •  fxgroup
  • | Commercial Member | Joined Nov 2010 | 1,178 Posts
EURCAD

On M chart we see long buyers / sellers tails as an information of the battle betwen them, so we have a RM.
On W chart the 2 W ago BUOB pushed the P back into the old RM, so all we have to do is waiting the P to RET on the old S in order to buy till the old RM's R !
Attached Image(s) (click to enlarge)
Click to Enlarge

Name: ECM.png
Size: 51 KB
Click to Enlarge

Name: ECW.png
Size: 48 KB
Nothing personal,just business
 
 
  • Post #2,127
  • Quote
  • Dec 11, 2014 11:06am Dec 11, 2014 11:06am
  •  Ttf
  • | Joined Nov 2014 | Status: Member | 50 Posts
Quoting fxgroup
Disliked
EURCAD On M chart we see long buyers / sellers tails as an information of the battle betwen them, so we have a RM. On W chart the 2 W ago BUOB pushed the P back into the old RM, so all we have to do is waiting the P to RET on the old S in order to buy till the old RM's R ! {image} {image}
Ignored
thank you for your your analysis of eurcad, especially marking the range on the monthly was great because it reminded me to not zoom out to far on monthly charts!
I have a question about the weekly chart, though: Wouldn't it be a riskier trade against the trend to buy at the resistance of the RM?
 
 
  • Post #2,128
  • Quote
  • Dec 11, 2014 11:09am Dec 11, 2014 11:09am
  •  Ttf
  • | Joined Nov 2014 | Status: Member | 50 Posts
Quoting Beertje
Disliked
EURUSD Monthly in downtrend. Weekly in downtrend. Daily in RM. I entered at the top of the daily RM. 2D PB at the weekly level. {image}
Ignored
Are you still in? I'm wondering how you managed the trade because price travelled higher again...
I also wanted to ask you if you could show how you confirmed the 2DPB of the daily with the higher timeframes. Did you wait for a weekly close or did you enter because you recognized a downtrend?
 
 
  • Post #2,129
  • Quote
  • Dec 11, 2014 11:35am Dec 11, 2014 11:35am
  •  Ttf
  • | Joined Nov 2014 | Status: Member | 50 Posts
About nzdjpy:
Monthly is in uptrend
On the weekly price formed a range market
On the daily a PB at support of the RM appeared.

My question now is: Is this PB confirmed by the higher timeframes, or do we have to wait for the close of the last weekly candle?

Best regards!
Attached Image(s) (click to enlarge)
Click to Enlarge

Name: nzdjpy monthly.PNG
Size: 21 KB
Click to Enlarge

Name: nzdjpy weekly.PNG
Size: 33 KB
Click to Enlarge

Name: nzdjpy daily.PNG
Size: 24 KB
 
 
  • Post #2,130
  • Quote
  • Dec 11, 2014 5:17pm Dec 11, 2014 5:17pm
  •  fxgroup
  • | Commercial Member | Joined Nov 2010 | 1,178 Posts
Yesterday I posted on my FB page :

"NZDCHF...strong BUOB at bullish TL as dynamic support, I'm waiting to see a RET on 0.7518 in order to push the price higher to 0.7684."

Look where today candle retraced...no indicators, no fancy lines, nothing, only the price :
Attached Image (click to enlarge)
Click to Enlarge

Name: NC.png
Size: 49 KB
Nothing personal,just business
 
 
  • Post #2,131
  • Quote
  • Dec 11, 2014 9:25pm Dec 11, 2014 9:25pm
  •  Beertje
  • | Joined Oct 2011 | Status: Member | 446 Posts
Quoting Ttf
Disliked
{quote} Are you still in? I'm wondering how you managed the trade because price travelled higher again... I also wanted to ask you if you could show how you confirmed the 2DPB of the daily with the higher timeframes. Did you wait for a weekly close or did you enter because you recognized a downtrend?
Ignored
Of course I closed my positions at the M level. Why? Dec 4: EURMinimum Bid Rate, Dec 5: USDNon-Farm Employment Change.
Strong M level, the prise was not there in the las 2 years, what dou you thing, will the prise break this level after 6 month bearish candle?
Attached Image(s) (click to enlarge)
Click to Enlarge

Name: EURUSDMonthly.png
Size: 77 KB
Click to Enlarge

Name: EURUSDWeekly.png
Size: 78 KB
Click to Enlarge

Name: EURUSDDaily.png
Size: 69 KB
 
 
  • Post #2,132
  • Quote
  • Dec 12, 2014 5:18am Dec 12, 2014 5:18am
  •  ponchofx
  • | Joined Jul 2014 | Status: Member | 102 Posts
NZDJPY
I would be cautious with longs at these levels. I am actually looking to short this pair.
1. From technical perspective - Look left on the M chart, we are near major MR.
Attached Image (click to enlarge)
Click to Enlarge

Name: NZDJPYM.jpg
Size: 237 KB

W chart shows dynamic S broken in the past and is tested at the moment from the underside as R. To resume bullish bias at this point P needs to close above TL and confirm on retest
Attached Image (click to enlarge)
Click to Enlarge

Name: NZDJPYWeekly.png
Size: 33 KB

On Daily we have a nice bearish Quasimodo pattern forming. Support has been breached, P retraced and tested DR and couldn't close above Monthly open.
Attached Image (click to enlarge)
Click to Enlarge

Name: NZDJPYDaily.png
Size: 38 KB


2. Fundamentally, the talk from the RBNZ for weaker NZD will keep weighing on NZD not only against USD but across the board more or less
 
 
  • Post #2,133
  • Quote
  • Dec 12, 2014 6:38am Dec 12, 2014 6:38am
  •  ponchofx
  • | Joined Jul 2014 | Status: Member | 102 Posts
EURNZD
I see a potential for about 1000 pips to the upside if the right conditions are met
P is supported by both static and dynamic S. Bulls have shown strenght as they managed to engulf previous swing high and close above M RM. P has been since then compressing and is back in the RM at important MM level.
Attached Image (click to enlarge)
Click to Enlarge

Name: EURNZDMonthly.png
Size: 41 KB

On D P broke TL and RET to it + MM level and we will see how today candle closes. So far it looks good.
Attached Image (click to enlarge)
Click to Enlarge

Name: EURNZDDaily.png
Size: 46 KB
 
 
  • Post #2,134
  • Quote
  • Dec 13, 2014 3:10am Dec 13, 2014 3:10am
  •  Ttf
  • | Joined Nov 2014 | Status: Member | 50 Posts
How about GBPJPY ?
Monthly is an a strong uptrend.
Weekly formed a RM. Last week there was a bullish breakout with close above RM. The daily confiramtion was the 2DPB which accurded this week. After this there was another weekly confirmation, as this weeks bar closed above the RM. The weekly formation now looks like a 2D Innverted PB
I guess yesterday's indecision bar will act as a inside bar. Sellers were also not able to drive price lower than the low of the daily 2DPB.

BTW, how do you draw those colour filled rectangles?
Attached Image(s) (click to enlarge)
Click to Enlarge

Name: gbpjpy weekly.PNG
Size: 20 KB
Click to Enlarge

Name: gbpjpy daily.PNG
Size: 30 KB
 
 
  • Post #2,135
  • Quote
  • Dec 13, 2014 7:21am Dec 13, 2014 7:21am
  •  uidro
  • | Joined Feb 2014 | Status: Member | 78 Posts
Quoting fxgroup
Disliked
EURCAD On M chart we see long buyers / sellers tails as an information of the battle betwen them, so we have a RM. On W chart the 2 W ago BUOB pushed the P back into the old RM, so all we have to do is waiting the P to RET on the old S in order to buy till the old RM's R !
Ignored
is what happened !! P is arrived at TG and CA the RM but not to R 1.4435 . Now i wait to understand WPG. Come back in RM or go on bullish? In M just have a LH but the T is bearish for many mounth and w and D too.
Attached Image(s) (click to enlarge)
Click to Enlarge

Name: EURCADWeekly1.png
Size: 31 KB
Click to Enlarge

Name: EURCADDaily1.png
Size: 33 KB
 
 
  • Post #2,136
  • Quote
  • Dec 13, 2014 7:43am Dec 13, 2014 7:43am
  •  uidro
  • | Joined Feb 2014 | Status: Member | 78 Posts
Quoting Ttf
Disliked
How about GBPJPY ? Monthly is an a strong uptrend. Weekly formed a RM. Last week there was a bullish breakout with close above RM. The daily confiramtion was the 2DPB which accurded this week. After this there was another weekly confirmation, as this weeks bar closed above the RM. The weekly formation now looks like a 2D Innverted PB I guess yesterday's indecision bar will act as a inside bar. Sellers were also not able to drive price lower than the low of the daily 2DPB. BTW, how do you draw those colour filled rectangles? {image} {image}
Ignored
-Hi Ttf, your rectangle blu are not a RM, so are not possible a breakout.
-The weekly formation can't be a 2D inverted PB, maibe a 2W but i'm not sure exist a 2(TF) IPB.......so busy but if exist the candle bearish nedd to close below the candle bullish previous
- your 2DPB are wrong cause for to be a 2DPB the candle bullish need to close above the candle bearsh previous.

Appean only a reaction of sellers to the BRN 190 and at the R (TF M ) 188.88 . RET to BRN 185 , we can wait here a opportunity of trade.
Attached Image (click to enlarge)
Click to Enlarge

Name: GBPJPYMonthly.png
Size: 39 KB
 
 
  • Post #2,137
  • Quote
  • Dec 13, 2014 7:54am Dec 13, 2014 7:54am
  •  uidro
  • | Joined Feb 2014 | Status: Member | 78 Posts
Example of 2 (TF) PB bullish
Attached Image (click to enlarge)
Click to Enlarge

Name: Immagine 17.png
Size: 11 KB
 
 
  • Post #2,138
  • Quote
  • Dec 14, 2014 4:30am Dec 14, 2014 4:30am
  •  Dariusz
  • | Joined Jul 2011 | Status: Member | 242 Posts
Hi Everyone,


In recent week liquidity dropped in most majors it means we entered in holiday season, I suggest to limit your trading activity (volume and frequency), because market changed characteristic in these days.

Regards.
 
 
  • Post #2,139
  • Quote
  • Dec 14, 2014 1:14pm Dec 14, 2014 1:14pm
  •  Ttf
  • | Joined Nov 2014 | Status: Member | 50 Posts
Quoting uidro
Disliked
Example of 2 (TF) PB bullish {image}
Ignored
Well I know the most traders use this kind of definiton, but IMHO this is only half the truth. For me the second bar doesn't have to close above the first bar because I don't care about the colour of the 2DPB. I guess you don't mind the colour of a normal PB , so why should only green 2DPB be bullish? (of course they are bullisher than red PB, but red PB still are a bulish sign)
If something like a inverted PB exists, and works, a 2DIPB should work to, because it is the same thing formed over to sessions. It's the same thing with the morning star. Put the three bars together and you see that they form a PB over 3 sessions.
 
 
  • Post #2,140
  • Quote
  • Dec 14, 2014 1:21pm Dec 14, 2014 1:21pm
  •  Ttf
  • | Joined Nov 2014 | Status: Member | 50 Posts
Quoting Dariusz
Disliked
Hi Everyone, In recent week liquidity dropped in most majors it means we entered in holiday season, I suggest to limit your trading activity (volume and frequency), because market changed characteristic in these days. Regards.
Ignored
That is a very good advice! As I don't have a real account so far, I will keep working with my demo account and watch the market during holiday, if I have some time left...
 
 
  • Commercial Content
  • /
  • Beyond the Candles
  • Reply to Thread
    • 1 105106Page 107108109 126
    • 1 Page 107 126
0 traders viewing now
  • More
Top of Page
  • Facebook
  • Twitter
About FF
  • Mission
  • Products
  • User Guide
  • Media Kit
  • Blog
  • Contact
FF Products
  • Forums
  • Trades
  • Calendar
  • News
  • Market
  • Brokers
  • Trade Explorer
FF Website
  • Homepage
  • Search
  • Members
  • Report a Bug
Follow FF
  • Facebook
  • Twitter

FF Sister Sites:

  • Metals Mine
  • Energy EXCH
  • Crypto Craft

Forex Factory® is a brand of Fair Economy, Inc.

Terms of Service / ©2023