DislikedHey guys been a while..... Hope everyone is well?
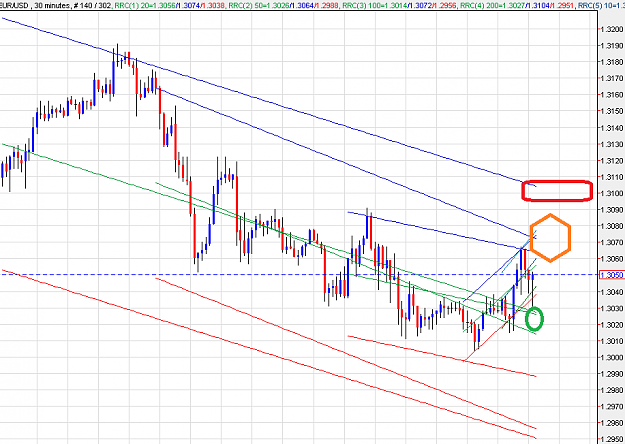
The retracement to 1.34XX made on the daily chart being also the 50% Fib level made it an almost perfect short entry. I have 2 short positions thus far from 1.3450 and 1.3250. Daily chart suggest 1.2950/1.29 maybe within sights for this week, lets see, if we do i will most likely take 2/3 profit from my positions. I also think then we will have a bounce back to 1.3150/1.32 which will then give the Euro the strength needed to then come back and break 1.2950 and head to 1.27 my take profit target...Ignored
As many of you know by my posts I follow US Bond Yields for clues on what is happening in the Money Flows. I just found this article that gives an excellent explanation of what is going on ALL of a sudden. I will post the link and the article as well and then add my personal touch comments as my own take on matters especially as applies to Correlation and changes in patterns of movements. There are two or three cross currents happening at once so one view only makes it too simple to explain.
http://www.actionforex.com/analysis/...0120314161436/
Is the Wait for Treasury Yields to Move Higher Finally Over?
The dollar continues to be buoyed by the Fed's improved outlook on the US economy and the news that most of the US's largest banks are well-capitalised enough to withstand another recession. Even though four banks failed including Citi Bank this isn't what the markets are concentrating on today. Yield hungry investors are helping to keep the upward momentum going as the banks that passed the tests are now free to increase dividend pay-outs and share buy backs. Even Citi Bank announced that it would be paying a dividend this year.
Fed action is foremost on everyone's minds. Signs of stabilisation in the Eurozone (or a lack of any more bad news) along with the better tone to economic data is causing the "normalisation" trade to be put back on. In an environment where the US is picking back up and inflation is at a tolerable level then you would expect stocks to rise along with yields, especially when Treasury yields are rising from an incredible low base.
Likewise, the Vix index - Wall Street's fear gauge - is back at the May/ June 2010 lows, which sets the stage for a prolonged rally in equities.
Only a few days ago the markets looked very sticky around some major levels like 13,000 in the Dow. However, after detecting a brighter tone in the Fed's words that caution has been replaced with optimism. A wiser person than I said that it's much easier to pick spot the bottom in a market than it is to spot the top - and that seems to be the case now and after a pause stocks may move higher.
The writing has been on the wall for a while for Treasury yields to bust higher. Not only is the Vix at multi-month lows and oil prices are significantly higher since the start of the year, but the cost to insure North American investment grade credit from default has been on a downtrend since late November. Usually the IG CDS index has a good inverse correlation with 10-year Treasury yields as you can see in the chart below.
http://www.actionforex.com/images/st...2012030861.gif
PLEASE NOTE THIS IS A BLOOMBERG CHART AND DOES NOT REPRESENT THE PRICES OFFERED BY FOREX.COMHowever, while there are multiple influences on the bond market, make no doubt that the Fed is its master. Thus, the next question to ask is how high will the Fed want yields to go? With a huge debt burden, the US can't really afford rates to be too high. Thus, we are watching 2.4% - the November high - with a mixture of curiosity and a bit of fear, as this could prove to be fairly hardy resistance. Since the move higher in yields is pivotal to sustain dollar gains, especially in USDJPY, this level is definitely one to watch.
In the very short term watch 1.30 in EURUSD. The pair is very weak within its range and as we mentioned before, now that China and Japan have depleted FX reserves the central bank reserve diversification story is one less pillar of support for the single currency. Thus this cross could be vulnerable below 1.30.
The dollar rally will run out of steam at some stage, but for now this is the major theme dominating markets. We would note that the Dollar index is currently testing 80.50, a major resistance level , and the January high, is coming up just below 82.00, so the greenback may slow as it approaches this level in the short term.
Kno's Comments:
The above is a very good explanation on the US Bond side of the equation and now I will turn to the other factors including the quick sell off in Gold.
First of all I again POINT OUT these are NOT FREE Trading Markets.
The ENEMY of the FED and the other Central Banks only as it being a Barometer is the PRICE OF GOLD. They DEFINITELY helped start it down yesterday Short Term. That helped Stength in the US Dollar Index as the REAL FEAR remains in holding Euro's AND SINCE 57.6% of the US Dollar Index is EUR/USD there is Stength in the US Dollar Index.
Now we TURN to Risk On and Risk Off and even though it appeared to be Risk On not everything rose, Gold being one of them.
WE also have a suddenly weaker USD/JPY for reasons explained over the last days or week. Then we turn to CORRELATION and now you can understand why EUR/USD is not Rising as the Dow rises.
I can add much more and will if there are any follow up questions. I hope this post has been a help to those looking for answers.