hi frindes i think my broke lie about spreads . is any indicator that calculate real spread
Ignored
It won't help you.
The indicator will show you the same lie because it has to use the information that you see on the chart yourself.
> With Google search:
- Check if broker is listed as an scammer: https://tradersunion.com/brokers-blacklist/forex/
- Check if other traders that use the same broker has posted similar complaints on social media like forexfactory, Twitter, Facebook Instagram
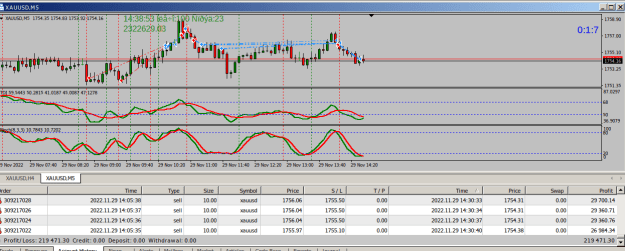
there was something wrong with my platform and I realised it 5 minutes later. It was not moving at all and I had to use my mobile to take partial profit and also to move the stop to b/e
{quote} It won't help you. The indicator will show you the same lie because it has to use the information that you see on the chart yourself. > With Google search: - Check if broker is listed as an scammer: https://tradersunion.com/brokers-blacklist/forex/ - Check if other traders that use the same broker has posted similar complaints on social media like forexfactory, Twitter, Facebook Instagram
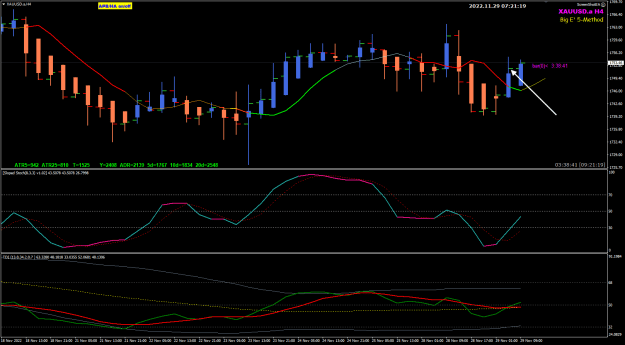
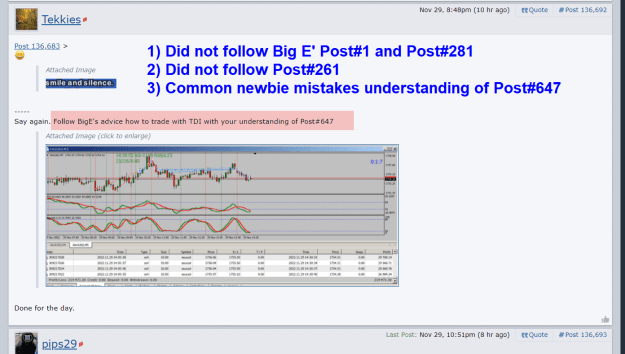
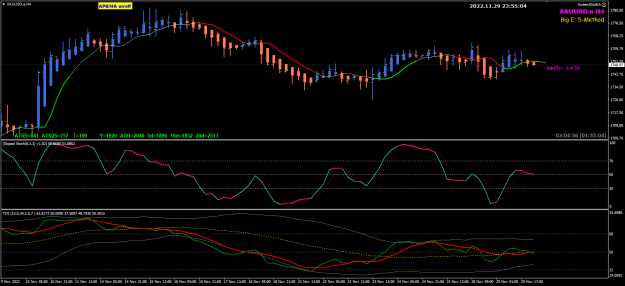
Post 136,683 > {image} ----- Say again. Follow BigE's advice how to trade with TDI with your understanding of Post#647 {image} Done for the day.
Attached Image (click to enlarge)
Ignored
hey @Tekkies
Thanks for your newbie trade learning examples.
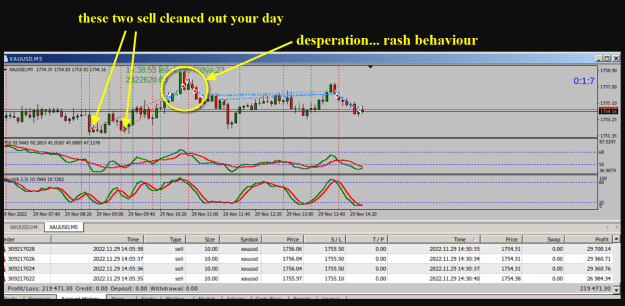
You did not follow Big E advice in this thread. You will continue to blow your accounts when you blindly trade the TDI without learning Big E' 5-Method.
Your two sell trades during the 3rd 4-hour trade window was the killer to start another losing day.
Attached Image (click to enlarge)
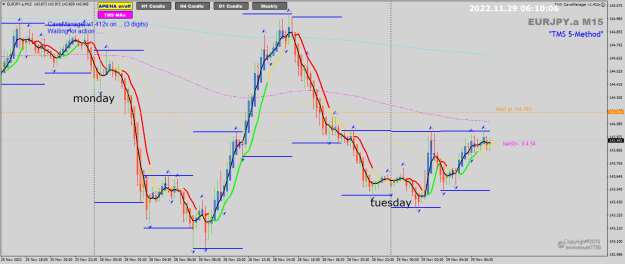
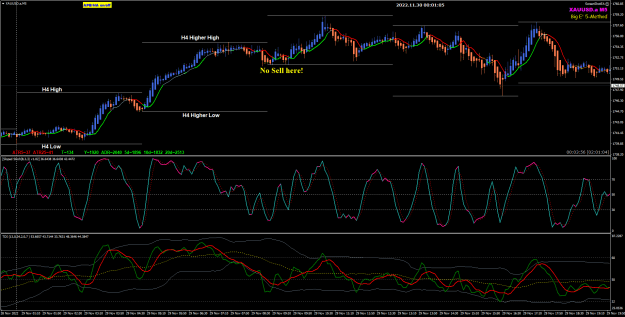
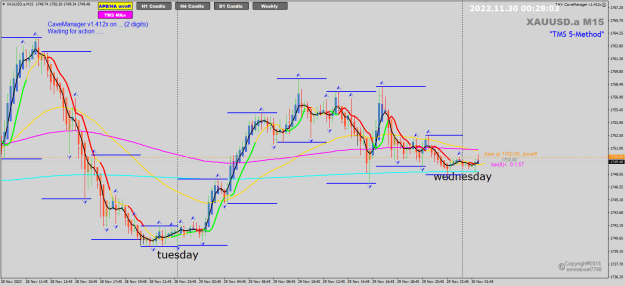
study this M5 chart below with the H4 high-low
Attached Image (click to enlarge)
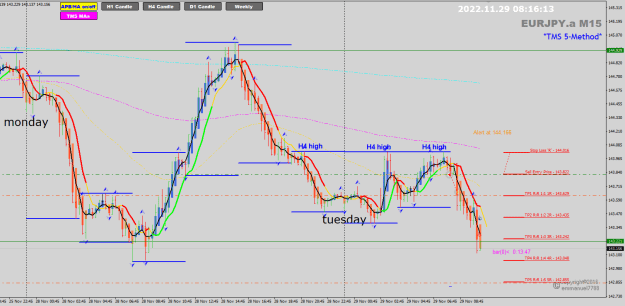
and review this H4 chart below
today you can follow this H4
Attached Image (click to enlarge)
...
Honesty is a very expensive gift. You wont find it in cheap people.WBuffett
***************************************************************************************** Always check your trading calendar - market news and economic events etc. when you start you trading day
{quote} hey @Tekkies Thanks for your newbie trade learning examples. You did not follow Big E advice in this thread. You will continue to blow your accounts when you blindly trade the TDI without learning Big E' 5-Method. Your two sell trades during the 3rd 4-hour trade window was the killer to start another losing day. {image} study this M5 chart below with the H4 high-low {image} and review this H4 chart below today you can follow this H4 {image} ... {image}
Ignored
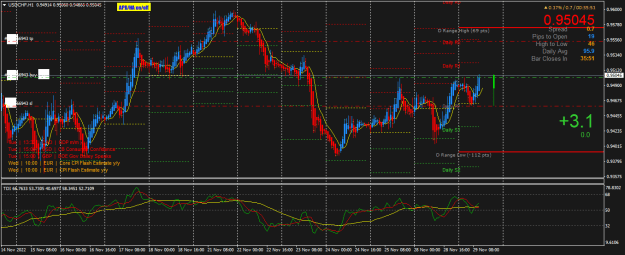
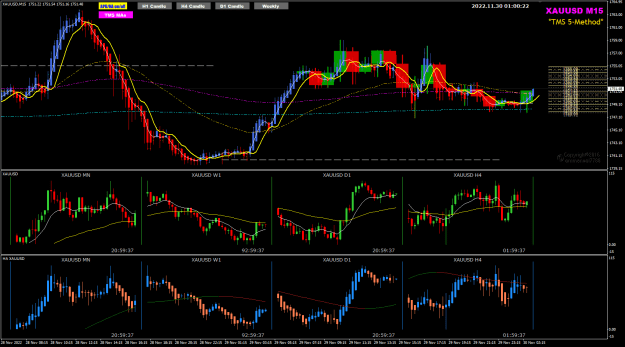
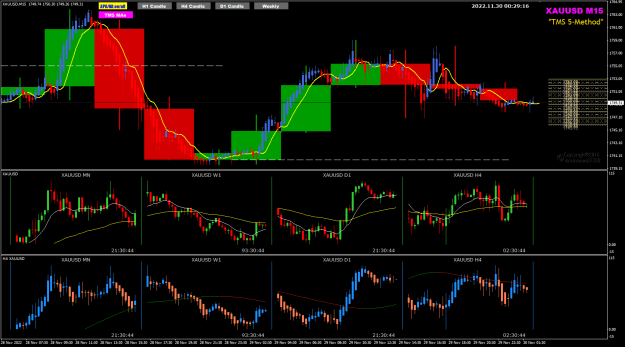
at the start of day: know the 4H price action and also the Daily , Weekly ... know where the PA in relation to its 10EMA and 5EMA of every timeframe
Attached Image (click to enlarge)
Nov 30,
the 4hr or the H4 is sideways, and you can see why on the Daily and Weekly the 4hr also refers to the 4-hour trade window when we trade the lower timeframes like the H1 and M15 Do Not trade the M5 manually. I use M5 for TMS MEME and TMS EVO entries only after I initiated the trade baskets.
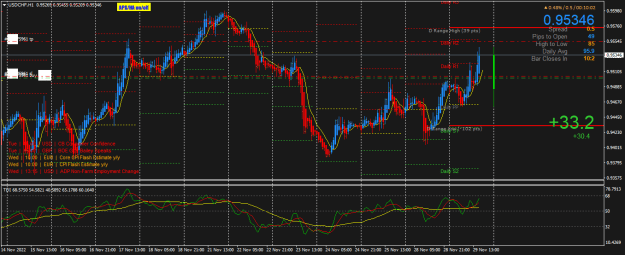
On this M15 chart below, you see the PA is trapped between the EMAs 50,200 and 800. and the BRN 1750 ... a lot can happen here!
Attached Image (click to enlarge)
...
Honesty is a very expensive gift. You wont find it in cheap people.WBuffett
{quote} at the start of day: know the 4H price action and also the Daily , Weekly ... know where the PA in relation to its 10EMA and 5EMA of every timeframe {image} Nov 30, the 4hr or the H4 is sideways, and you can see why on the Daily and Weekly the 4hr also refers to the 4-hour trade window when we trade the lower timeframes like the H1 and M15 Do Not trade the M5 manually. I use M5 for TMS MEME and TMS EVO entries only after I initiated the trade baskets. On this M15 chart below, you see the PA is trapped between the EMAs 50,200 and 800. and...
Ignored
Nov30
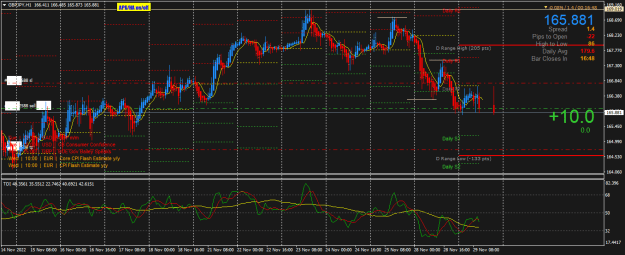
- we have a M15/H1 setup
- you know the risk at this time therefore its your job as the traders to manager this risk .
Attached Image (click to enlarge)
..
Honesty is a very expensive gift. You wont find it in cheap people.WBuffett
{quote} at the start of day: know the 4H price action and also the Daily , Weekly ... know where the PA in relation to its 10EMA and 5EMA of every timeframe {image} Nov 30, the 4hr or the H4 is sideways, and you can see why on the Daily and Weekly the 4hr also refers to the 4-hour trade window when we trade the lower timeframes like the H1 and M15 Do Not trade the M5 manually. I use M5 for TMS MEME and TMS EVO entries only after I initiated the trade baskets. On this M15 chart below, you see the PA is trapped between the EMAs 50,200 and 800. and...
Post 136,694: today you can follow this H4 Yea, right. What a briljent idea with H4 in consolidation, > TDI green between 2/4 The old grizzle bear is once more zonked out of his mind.
Ignored
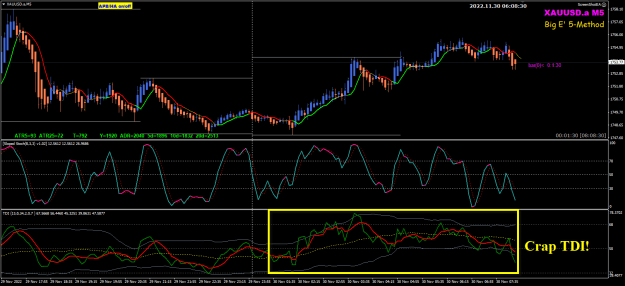
hey @Tekkies
what happen to your SMILE and SILENT? Does not work, right?
just like your old mental ignore ... it never work!
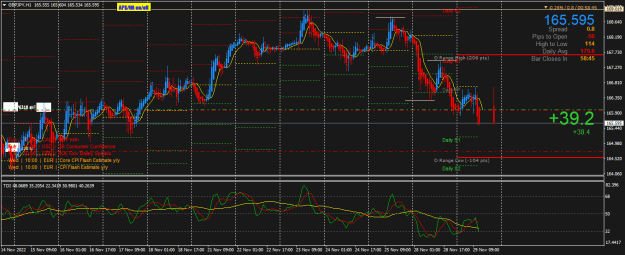
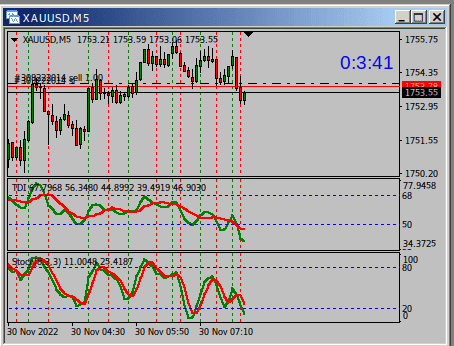
that's correct ... this morning we trade follow that H4 but you do not have the trading skills to trade consolidation market type conditions.
your M5 TDI is all crap ... cross up ... cross down ... bounce up and bounce down ... nonsense!
Attached Image (click to enlarge)
trading M15 ... Price Action is king!
Attached Image (click to enlarge)
...
Honesty is a very expensive gift. You wont find it in cheap people.WBuffett