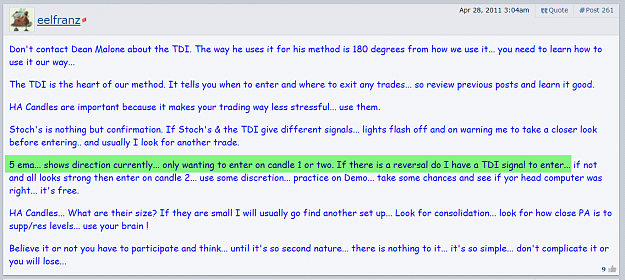
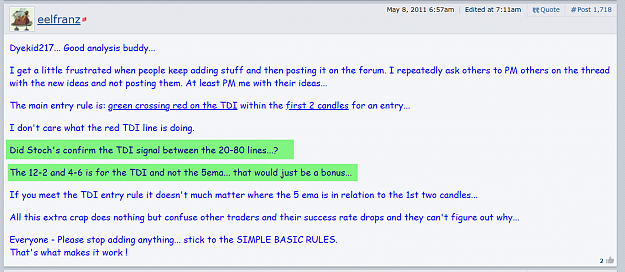
Disliked{quote} Can you please copy/past #261,1718 can't find them. --- Referring to post's does not mean "missed them" Don't make assumptions, post fact's. ---- "show members trades taken with Price Action and Momentum" Are you making jokes again. Emmanuel? You should really try and use TDI with post#647 for a change. You know drill: Green cross red, angle between 12/2 - 4/6, stoch confirm direction. You will notice that TDI does "One Shot One Kill 15 to 20 pips" many times, the best part is no need to wait for a Arjun candle. {image}Ignored
don't be lazy.
you know how to get to Post#261 and Post#1718.
if you had read and understood Post#261 and Post#1718, you will learn the 5-Method and how many different ways the OP view his charts.
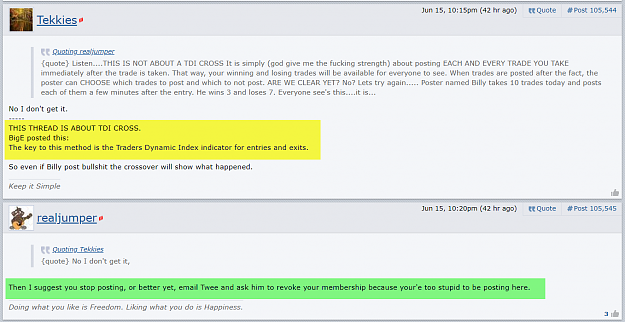
Trading Made Simple is not just about the TDI green cross red. If you keep on repeating "this thread is abut TDI cross" then you only show that you are really too stupid to be posting in this thread.
there is no post #261,1718.
go back and read all the OP posts in this thread and study those charts he posted. Cover the indicators sub-windows and you will learn the Price Action and Momentum on the price charts. You don't need the TDI. You can use the Fozzy-RSI and it will work.
Instead of arguing day-in day-out about the three letters "TDI", just switch to the use of the trading platform' standard RSI. You can add the gree price line by simply adding a 2-period EMA to the RSI(13) data. If you want to trade the green price line cross the red trade signal line, you can add another moving average to the same RSI(13) data. This is the Fozzy-RSI which is the idea of the Traders Dynamic Index was copied from.
Go back to this website which you provided link, and it is explained there.
https://forex-station.com/viewtopic....38#p1295362638
Replicating each TDI for mobile and charts without the TDI installed
works on all trading platforms
Standard TDI (2005)
- Apply an RSI indicator to your mobile chart with the color set to your background's color (or "invisible" or "none") if you have that option.
Set the period to "13", Apply it to "Close". - Insert a Moving Average into the RSI's indicator window and set that period to "2", "Simple", apply it to "Previous Indicator's Data" and make that line Green.
- Insert another Moving Average indicator into the RSI's indicator window and set that period to "7", "Simple", apply it to "Previous Indicator's Data" and make that line Red.
- Insert the Bollinger Bands indicator into the RSI's indicator window and set that to "34" with a deviation of "1.618", apply it to "First Indicator's Data" and set that line to Blue.
- Inset one more Moving Average again into the RSI's indicator window and set it to "34", "Simple", apply it to "First Indicator's Data" and set that line to Yellow.
Honesty is a very expensive gift. You wont find it in cheap people.WBuffett
1