• Home
  • Forums
  • Trades
  • News
  • Calendar
  • Market
  • Brokers
  • Login
  • Join
  • User/Email: Password:
  • 8:55am
Menu
  • Forums
  • Trades
  • News
  • Calendar
  • Market
  • Brokers
  • Login
  • Join
  • 8:55am
Sister Sites
  • Metals Mine
  • Energy EXCH
  • Crypto Craft

Options

Bookmark Thread

First Page First Unread Last Page Last Post

Printable Version

Similar Threads

Trading Made Simple the right way, and other trading lessons 233 replies

Monitor for 'Trading Made Simple' system 549 replies

MTF Indicators for the 'Trading Made Simple' system 239 replies

Indicators for the 'Trading Made Simple' system 339 replies

Trading Made Simple system follower - Thanks to eelfranz 9 replies

  • Trading Systems
  • /
  • Reply to Thread
  • Subscribe
  • 45,889
Attachments: Trading Made Simple
Exit Attachments

Trading Made Simple

  • Last Post
  •  
  • 1 48754876Page 487748784879 5766
  • 1 Page 4877 5766
  •  
  • Post #97,521
  • Quote
  • Aug 20, 2019 4:21am Aug 20, 2019 4:21am
  •  Tekkies
  • Joined Nov 2015 | Status: Closet Trader | 5,896 Posts | Invisible
Follow TDI: Post 97,098
- Learn work with what the TDI is showing you not against TDI.
- Don't be eager to place a trade.
Make your own observation how TDI gave a trade signal. Look at and compare:
- both chart's
- support / resistance
- momentum (angle of green)
- bar size
- wick length and placement
- what is stoch doing
In short apply Post#647 to both chart's.
Attached Image (click to enlarge)
Click to Enlarge

Name: wag.PNG
Size: 126 KB


Attached Image (click to enlarge)
Click to Enlarge

Name: later.PNG
Size: 53 KB
Keep it Simple
2
  • Post #97,522
  • Quote
  • Aug 20, 2019 5:23am Aug 20, 2019 5:23am
  •  emmanuel7788
  • Joined Nov 2008 | Status: Member | 29,517 Posts
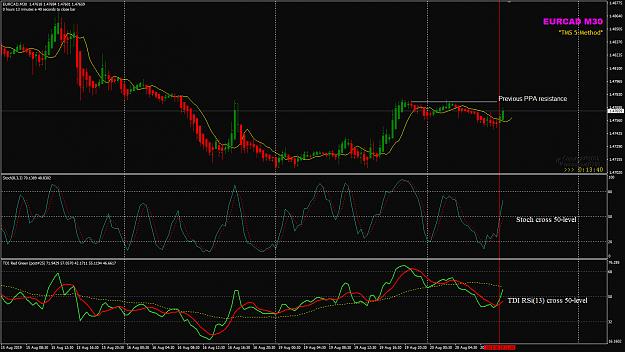
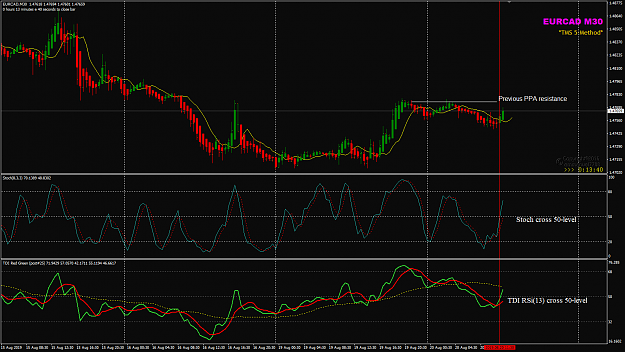
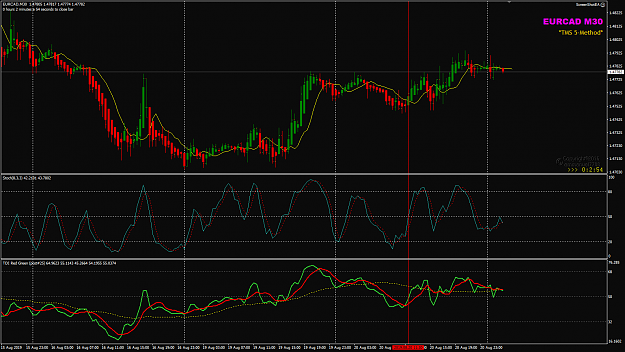
When Stoch(8,3,3) %K cross %D is a signal
When TDI RSI(13) MA(2) cross (MA(7) is also a signal
When both the Stoch and TDI cross their 50-level, that is bonus signal...

When both Stoch and TDI shows the same signal, we have a trade setup but .... look left to see any support and resistance,


Example EURCAD M30 Aug 30 London session.

Attached Image (click to enlarge)
Click to Enlarge

Name: EURCAD Aug 20 M30 RSi and SToch crossed 50level  20-08-2019 17-14-06.png
Size: 55 KB
Honesty is a very expensive gift. You wont find it in cheap people.WBuffett
1
1
  • Post #97,523
  • Quote
  • Aug 20, 2019 8:01am Aug 20, 2019 8:01am
  •  muotre
  • | Joined May 2017 | Status: Member | 10 Posts
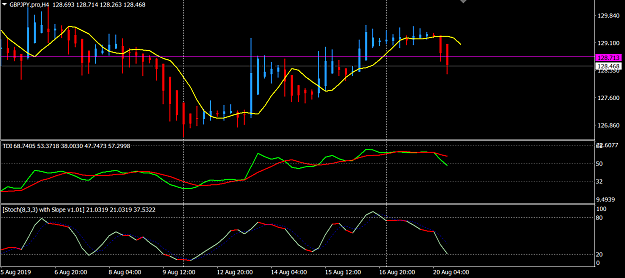
quick question, i'm looking at this system to check on live charts if it's something for me. I know how HA candles look but i don't know how to read them, looked at an explainer video and it confused me even more.

In the screenshot you see the last h4 candle where i would have made an entry at the start of the candle according to this system (even though it's the 3rd red candle, there was enough room to the downside without significant resistance). The purple line is where the price was at the start of the candle, i placed this line shortly after the start of this candle as a marker where i would have shorted. Yet the HA candle shows a big body to the upside, where price has never been during this candle. How do you see where the actual price has been in HA candles? Because i think knowing where actual price has been during a timeframe is important, not only for live trades but for backtesting as well. Now i feel like i'm blind for actual price moves.

I do think this system has promise because this trade would have already made +40 pips at the low, now at approximately +25 pips with 1 hour to go on this h4 candle.

Attached Image (click to enlarge)
Click to Enlarge

Name: screen.png
Size: 37 KB
  • Post #97,524
  • Quote
  • Edited at 1:04pm Aug 20, 2019 9:28am | Edited at 1:04pm
  •  Tekkies
  • Joined Nov 2015 | Status: Closet Trader | 5,896 Posts | Invisible
Quoting muotre
Disliked
How do you see where the actual price has been in HA candles?
Ignored
Like this?
- Activate Candle bar.
- Change line thickness in HA Option\Colors
Attached Image

Not a nice chart to look at.
Keep it Simple
  • Post #97,525
  • Quote
  • Aug 20, 2019 9:33am Aug 20, 2019 9:33am
  •  ryudazooo
  • | Joined Aug 2019 | Status: Junior Member | 1 Post
Does anyone have this indicator and template?
I really want one.https://www.forexfactory.com/attachm...0&d=1532182138
  • Post #97,526
  • Quote
  • Aug 20, 2019 9:55am Aug 20, 2019 9:55am
  •  Vic80
  • | Joined Aug 2019 | Status: Member | 87 Posts
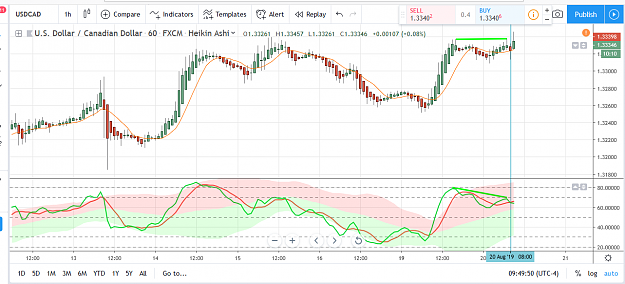
I live in Europe and I was trading on 1H time frame USDCAD. I entered where the blue line is. I entered at the begining of the candle with TDI cross. Also, I was seeing divergence between price and TDI. It started to move in my favour but the next candle moved in the opposite direction. I'm still in but close to my SL.
Attached Image (click to enlarge)
Click to Enlarge

Name: Image1.png
Size: 81 KB
  • Post #97,527
  • Quote
  • Aug 20, 2019 10:19am Aug 20, 2019 10:19am
  •  Britpip7
  • Joined Apr 2011 | Status: "Never Give Up - Never Surrender" | 1,608 Posts
Quoting Tekkies
Disliked
{quote} Lyk this? - Activate Candle bar. - Change line thickness in HA Option\Colors {image} Not a nice chart to look at.
Ignored
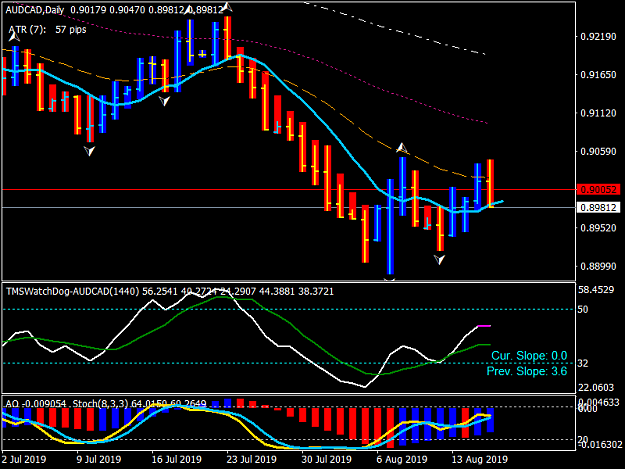
I overlay the APB candles with Bars as opposed to Candles

I find it easier on the eyes
Attached Image (click to enlarge)
Click to Enlarge

Name: AUDCADDaily 8-17-2019.png
Size: 41 KB
"To live with Passion, it takes Courage and Grace to survive"
2
  • Post #97,528
  • Quote
  • Aug 20, 2019 11:44am Aug 20, 2019 11:44am
  •  Tekkies
  • Joined Nov 2015 | Status: Closet Trader | 5,896 Posts | Invisible
Quoting Vic80
Disliked
I live in Europe and I was trading on 1H time frame USDCAD. I entered where the blue line is. I entered at the begining of the candle with TDI cross. Also, I was seeing divergence between price and TDI. It started to move in my favour but the next candle moved in the opposite direction. I'm still in but close to my SL. {image}
Ignored
- Did Stoch confirm direction?
Keep it Simple
  • Post #97,529
  • Quote
  • Aug 20, 2019 11:48am Aug 20, 2019 11:48am
  •  Vic80
  • | Joined Aug 2019 | Status: Member | 87 Posts
Yes, stochastic confirmed direction
  • Post #97,530
  • Quote
  • Aug 20, 2019 1:03pm Aug 20, 2019 1:03pm
  •  Tekkies
  • Joined Nov 2015 | Status: Closet Trader | 5,896 Posts | Invisible
Quoting Vic80
Disliked
Yes, stochastic confirmed direction
Ignored
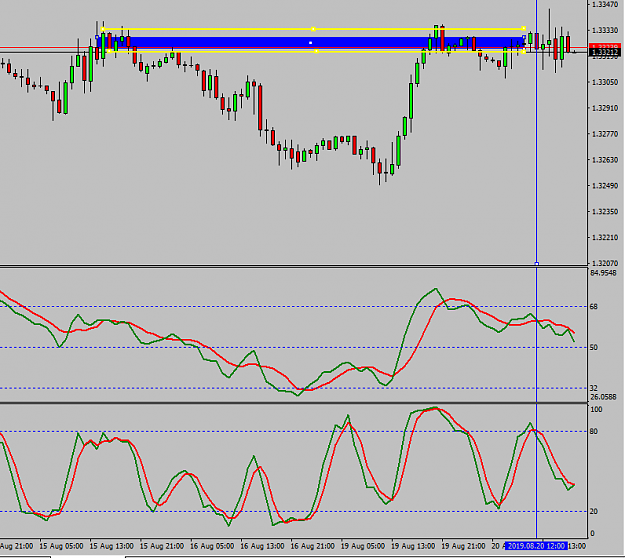
Blue = consolidation
Yellow = Support / Resistance
- Trade taken smack bang in the middle.
- Long term trend up (Look D1)
- No short term trend (Look H1)
- Wicks long / bottom of candle
- Bars are different size both direction
Attached Image (click to enlarge)
Click to Enlarge

Name: smack.PNG
Size: 33 KB
Keep it Simple
  • Post #97,531
  • Quote
  • Edited Aug 21, 2019 8:45am Aug 20, 2019 1:43pm | Edited Aug 21, 2019 8:45am
  •  DrDave
  • Joined Jun 2011 | Status: MEMBER: Temporary Suspension | 3,977 Posts | Invisible
Quoting Tekkies
Disliked
- Long term trend up (Look D1)
- No short term trend (Look H1)
- Wicks long / bottom of candle
- Bars are different size both direction
Ignored
USDCAD, right?

Here is what I see.
MN in downtrend.
W1 rallying
D1 has been in an up move due to the W1 rally, and "time is up" for it to drop.

H4 Also "time is up" to drop.
H1 A bit messy with the current sideways channel, but further supports a down move is imminent.
M15 just gives a zoomed-in view of the H1 ranging.

Conclusion: Weekly has been in a rally, supporting buyers. "Time is ended" for D1 to be up, and this view is supported by H4 and H1. A breakout of the current range is needed with commitment. Although the breakout CAN go either direction, the bias is to go down. OF course the D1 cannot fall immediately; it will take some cycling down and up of the smaller charts first.
The markets are speaking to you. Do you know their language?
IMT Pips This Year: -36
3
  • Post #97,532
  • Quote
  • Aug 20, 2019 2:12pm Aug 20, 2019 2:12pm
  •  Vic80
  • | Joined Aug 2019 | Status: Member | 87 Posts
Thank you so much for your analysis
  • Post #97,533
  • Quote
  • Aug 20, 2019 3:04pm Aug 20, 2019 3:04pm
  •  Tekkies
  • Joined Nov 2015 | Status: Closet Trader | 5,896 Posts | Invisible
Quoting DrDave
Disliked
{quote} That is USDCAD, right? Here is what I see. Long term trend is down, both monthly and weekly. Weekly is up as a rally to the Monthly, so this makes D1 up. However, "time is ended" for D1 to be up, and H4 supports this view. Also, "time is ended" for H1 to be up, but there is no commitment by either buyers or sellers for direction, as can be seen by the sideways movement of HA bars with small bodies and long wicks. M15 gives only a more zoomed-in view of the ranging of H1. Even though at the moment price is moving down, it is still well in...
Ignored
OF course DI can continue to go up, changing W1 / MN to the upside.
-----
Rather go by what TDI is currently showing: the here and now.
- past MIGHT indicate what will happen.
- future will always be unknown.
Keep it Simple
  • Post #97,534
  • Quote
  • Edited at 4:01pm Aug 20, 2019 3:16pm | Edited at 4:01pm
  •  DrDave
  • Joined Jun 2011 | Status: MEMBER: Temporary Suspension | 3,977 Posts | Invisible
Quoting Tekkies
Disliked
{quote} OF course DI can continue to go up, changing W1 / MN to the upside. ----- Rather go by what TDI is currently showing: the here and now. - past MIGHT indicate what will happen. - future will always be unknown.
Ignored
Great, if it works for you, keep doing it.

Of course the future is unknown. That is why after we do TA and determine the chart most likely to see action next and the mostly likely direction, we watch our LAGGING indicators and when a move finally comes, we look for those lagging indicators to confirm the move and then we harvest the pips.
The markets are speaking to you. Do you know their language?
IMT Pips This Year: -36
1
  • Post #97,535
  • Quote
  • Aug 20, 2019 7:24pm Aug 20, 2019 7:24pm
  •  emmanuel7788
  • Joined Nov 2008 | Status: Member | 29,517 Posts
Quoting muotre
Disliked
quick question, i'm looking at this system to check on live charts if it's something for me. I know how HA candles look but i don't know how to read them, looked at an explainer video and it confused me even more. In the screenshot you see the last h4 candle where i would have made an entry at the start of the candle according to this system (even though it's the 3rd red candle, there was enough room to the downside without significant resistance). The purple line is where the price was at the start of the candle, i placed this line shortly after...
Ignored

Study Post 9307 details... zoom in

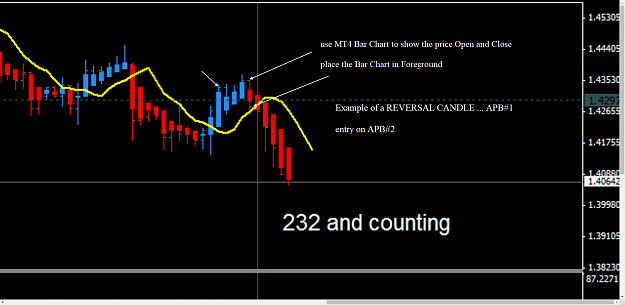
For a very experienced trader like Big E, he sees the real price on the APB/HA candle .
You can also see the real price Open, High, Low and Close much easier when you switch your chart to show as Bar Chart and set that to Foreground.


Post#9307 training chart... REVERSAL CANDLE

When Stoch(8,3,3) %K cross %D is a signal
When TDI RSI(13) MA(2) cross (MA(7) is also a signal

Post#261
If Stoch's & the TDI give different signals... lights flash off and on warning me to take a closer look before entering.. and usually I look for another trade.

5 ema... shows direction currently... only wanting to enter on candle 1 or two. If there is a reversal do I have a TDI signal to enter... if not and all looks strong then enter on candle 2... use some discretion...

Post#647
Look at the candles on the last reversal... big, little, what

Attached Image (click to enlarge)
Click to Enlarge

Name: Big E post 9307  REVERSAL CANDLE.png
Size: 95 KB


Have Fun, learn to spot REVERSAL CANDLE setup and you have one simple and easy solution... wait for another two more. PATIENCE.
Honesty is a very expensive gift. You wont find it in cheap people.WBuffett
1
1
  • Post #97,536
  • Quote
  • Aug 20, 2019 7:37pm Aug 20, 2019 7:37pm
  •  emmanuel7788
  • Joined Nov 2008 | Status: Member | 29,517 Posts
Quoting Vic80
Disliked
I live in Europe and I was trading on 1H time frame USDCAD. I entered where the blue line is. I entered at the begining of the candle with TDI cross. Also, I was seeing divergence between price and TDI. It started to move in my favour but the next candle moved in the opposite direction. I'm still in but close to my SL. {image}
Ignored
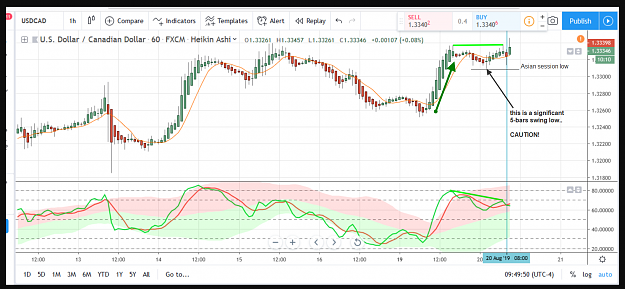
did you see the last rally on your chart?

very simple... there was no REVERSAL CANDLE and the market was sideways ... the PA in CONSOLIDATION (Post#647).... and selling into the Asian session low is selling into support....

Attached Image (click to enlarge)
Click to Enlarge

Name: USDCAD Vic80 FXCM Aug 20 21-08-2019.png
Size: 243 KB
Honesty is a very expensive gift. You wont find it in cheap people.WBuffett
1
1
  • Post #97,537
  • Quote
  • Aug 20, 2019 8:00pm Aug 20, 2019 8:00pm
  •  emmanuel7788
  • Joined Nov 2008 | Status: Member | 29,517 Posts
Quoting emmanuel7788
Disliked
When Stoch(8,3,3) %K cross %D is a signal When TDI RSI(13) MA(2) cross (MA(7) is also a signal When both the Stoch and TDI cross their 50-level, that is bonus signal... When both Stoch and TDI shows the same signal, we have a trade setup but .... look left to see any support and resistance, Example EURCAD M30 Aug 30 London session. {image}
Ignored
Yesterday
Attached Image (click to enlarge)
Click to Enlarge

Name: EURCAD Aug 20 M30 RSi and SToch crossed 50level  20-08-2019 17-14-06.png
Size: 55 KB


Today, as it is now,

EURCAD M30 ... do your own review and POMO

today's decision to trade should be easy now...

Attached Image (click to enlarge)
Click to Enlarge

Name: EURCAD Aug21 M30 0755 21-08-2019 07-54-51.png
Size: 51 KB
Honesty is a very expensive gift. You wont find it in cheap people.WBuffett
1
1
  • Post #97,538
  • Quote
  • Aug 21, 2019 12:13am Aug 21, 2019 12:13am
  •  DrDave
  • Joined Jun 2011 | Status: MEMBER: Temporary Suspension | 3,977 Posts | Invisible
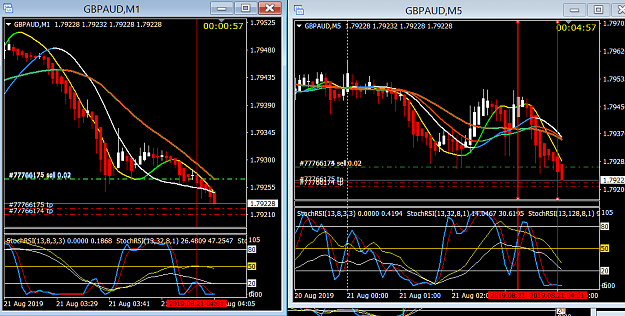
Guys, I already made 2x my daily goal, and I didn't even have breakfast yet.
GBPAUD falling, as I expected.

Attached Image (click to enlarge)
Click to Enlarge

Name: Screenshot1.png
Size: 89 KB
The markets are speaking to you. Do you know their language?
IMT Pips This Year: -36
1
  • Post #97,539
  • Quote
  • Aug 21, 2019 2:02am Aug 21, 2019 2:02am
  •  Tekkies
  • Joined Nov 2015 | Status: Closet Trader | 5,896 Posts | Invisible
Quoting DrDave
Disliked
Guys, I already made 2x my daily goal, and I didn't even have breakfast yet. GBPAUD falling, as I expected. {image}
Ignored
You like them indicator's.
-----
Based on what you posted Post 97,535 you really don't need all that wiggly rainbow lines on the chart.
Keep it Simple
1
  • Post #97,540
  • Quote
  • Aug 21, 2019 2:54am Aug 21, 2019 2:54am
  •  DrDave
  • Joined Jun 2011 | Status: MEMBER: Temporary Suspension | 3,977 Posts | Invisible
Quoting Tekkies
Disliked
{quote} You like them indicator's. ----- Based on what you posted Post 97,535 you really don't need all that wiggly rainbow lines on the chart.
Ignored
Actually, I don't even use them! That was just a chart with a template that I was experimenting with for someone else. (It also includes substitutes for TDI; just not obvious.)

But someone with some good analytical prowress can look at those images and find which of those indicators are valuable for trade signals, and then leave off the other ones.
The markets are speaking to you. Do you know their language?
IMT Pips This Year: -36
  • Trading Systems
  • /
  • Trading Made Simple
  • Reply to Thread
    • 1 48754876Page 487748784879 5766
    • 1 Page 4877 5766
21 traders viewing now, 6 are members:
atong
,
charlienoble
,
tommydoginti
,
Invisible
,
arcado
,
Xnmera
  • More
Top of Page
  • Facebook
  • Twitter
About FF
  • Mission
  • Products
  • User Guide
  • Media Kit
  • Blog
  • Contact
FF Products
  • Forums
  • Trades
  • Calendar
  • News
  • Market
  • Brokers
  • Trade Explorer
FF Website
  • Homepage
  • Search
  • Members
  • Report a Bug
Follow FF
  • Facebook
  • Twitter

FF Sister Sites:

  • Metals Mine
  • Energy EXCH
  • Crypto Craft

Forex Factory® is a brand of Fair Economy, Inc.

Terms of Service / ©2021